This arcticle is part of a multi-part series. Be sure to check out / stay tuned for the other parts!
In this series we look at processor configuration options either from the OS side or directly
in MSRs of the CPU and their effect on the power draw of the CPU.
Power Capping is feature that will artifically limit the electrically supplied power of a hardware component with the intention of making it less warm and / or using less electrical power draw.
This feature has been featured in some recent publications that focus on AI trainings on GPUs with the intention of getting the
energy consumption for their training down. [1][2][3]
Since most compute workloads for transactional and operational work is still done on CPUs they make up a significant
amount of compute, if not the most significant compute out there.
The power capping feature in CPUs is most renowned through the RAPL interface in modern Intel and AMD processors. If similar features exist in ARM etc. processors it is not know to us and not part of this article. We will focus on Intel / AMD only.
When getting aware of this feature as a Green Coder what first comes to mind is: Can I use this feature to make my code greener? Are there any negative effects from using power capping and which metric should I use to not run into rebound effects or drawbacks?
In order to answer this question we will look through a synthetic benchmark at the CPU energy at first and then also at the energy of the total machine and include embodied carbon.
Afterwards we will use a real-world use-case by using a CI/CD workload. The unit tests from the Django project.
How much energy can we save through CPU power capping on a workload and what are the drawbacks of using it?
Setting up power capping on Linux
sudo modprobe intel-rapl # often already activesudo apt install linux-tools-common linux-tools-$(uname -r)# we need this for perfsudo apt install sysbench # we need this for a testing workload
Once everything is installed you can check if the data can be read by issueing:
$ ls /sys/class/powercap/intel-rapl/
enabled intel-rapl:0 power subsystem uevent
# There should be a directory named intel-rapl:0 which represents your one installed CPU chip
$ cat /sys/class/powercap/intel-rapl/intel-rapl:0/name
package-0
$ cat /sys/class/powercap/intel-rapl/intel-rapl:0/constraint_0_name
long_term
$ cat /sys/class/powercap/intel-rapl/intel-rapl:0/constraint_1_name
short_term
$ cat /sys/class/powercap/intel-rapl/intel-rapl:0/constraint_0_power_limit_uw
25000000
# Which stands for25 W. The number will be different on your system
$ cat /sys/class/powercap/intel-rapl/intel-rapl:0/constraint_1_power_limit_uw
31250000
# Which stands for 31.25 W. The number will be different on your system, but is usually higher than the one before.
$ cat /sys/class/powercap/intel-rapl/intel-rapl:0/constraint_0_time_window_us
7995392
# Which stands for 7.99 s. The number will be different on your system
$ cat /sys/class/powercap/intel-rapl/intel-rapl:0/constraint_1_time_window_us
2440
# which stands for 2.44 ms. The number will be different on your system
As indicated in the comments above we are assuming your machine has one installed CPU chip. If you have more you have to set the power capping for every of these chips (intel-rapl:1, intel-rapl:2 etc.)
Now we can modify the power capping of the system live by just writing to these files.
If, for example, we want to limit the power draw to 10 W we issue:
$ echo "10000000" | sudo tee  /sys/class/powercap/intel-rapl/intel-rapl:0/constraint_0_power_limit_uw
# Set 10 W long_term

$ echo "10000000" | sudo tee  /sys/class/powercap/intel-rapl/intel-rapl:0/constraint_1_power_limit_uw
# Set 10 W short_term
We recommend to always set both limits unless you have specific reason not to. The rationale is to even catch power spikes which are not untypical in transacational workloads. The values constraint_1_time_window_us and constraint_1_time_window_us that govern this usually do not need to be touched.
Measurements
For measuring we need a standardized benchmark. We are using sysbench for this in the following version:
$ sysbench --version
sysbench 1.0.20
And we are using the following CPU:
$ lscpu
...
CPU(s):                  8
  On-line CPU(s) list:   0-7
  Model name:            Intel(R) Xeon(R) CPU E3-1240L v5 @ 2.10GHz
...
Sysbench can create a time-fixed, event-fixed, onbounded or rate-fixed workload on the system. For us a time-fixed or event-fixed workload is interesting. For this article we opt for a event-fixed workload.
In addition to using a benchmark we will track the energy consumption with perf. For this starting test we look at the CPU energy consumption only.
The final command is the following, where we put in 8 threads according to the max threads of the CPU we are using:
$ sudo perf stat -a -e power/energy-pkg/ -r 10 sysbench cpu run --cpu-max-prime=25000 --threads=8 --time=0 --events=15000 --rate=0sysbench 1.0.20 (using system LuaJIT 2.1.0-beta3)
Running the test with following options:
Number of threads: 8
Initializing random number generator from current time
Prime numbers limit: 25000
Initializing worker threads...
Threads started!
CPU speed:
events per second: 1770.68
General statistics:
total time: 10.0041s
total number of events: 17717
Latency (ms):
min: 3.49
avg: 4.52
max: 9.19
95th percentile: 4.49
sum: 80008.64
Threads fairness:
events (avg/stddev): 2214.6250/1.32
execution time (avg/stddev): 10.0011/0.00
...
We are now trying the benchmark with factory default (long_term is capped to 31.25 W and short term is 25 W), 25 W (100%), 20 W cap (80%), 15 W (60%), 10 W cap (40%) and 5 W (20%) cap. Every test we are repeating 10 times in a row. After every test we let the system cool down again to it’s base temperature (check with lm-sensors).
Power Cap
Time (s)
Events
Energy CPU Package (J)
Factory default
8.478750 +- 0.01%
15000
190.67 +- 0.19%
100%
8.478520 +- 0.02%
15000
190.75 +- 0.02%
80%
8.963080 +- 0.09%
15000
179.41 +- 0.10%
60%
10.49190 +- 0.06%
15000
157.43 +- 0.06%
40%
13.73100 +- 1.65%
15000
140.01 +- 0.38%
20%
30.22600 +- 1.90%
15000
154.12 +- 0.18%
What we can see in the results is that the more we power cap the longer the duration of the workload becomes.
This is expected.
The interesting value is the total energy of the workload (which already factors in time), but also the
coefficients for energy savings and time increase in comparison.
Here we see that around 80% there seems to be a sweet spot where the power savings even overcome the time increase and thus if energy efficiency is our highest concern this is the optimal operating point for the CPU.
An important question is now: How does this compare in a real-world use-case? And how are the results to be interpreted when we do look at the whole machine and not only the CPU? What happens if we factor in embodied carbon? Will results be the same?
For this we are using our Green Metrics Tool and are measuring the unit test of the Django project. This is by design a event-fixed workload also.
We have put all measurements online on the Green Metrics Tool Dashboard
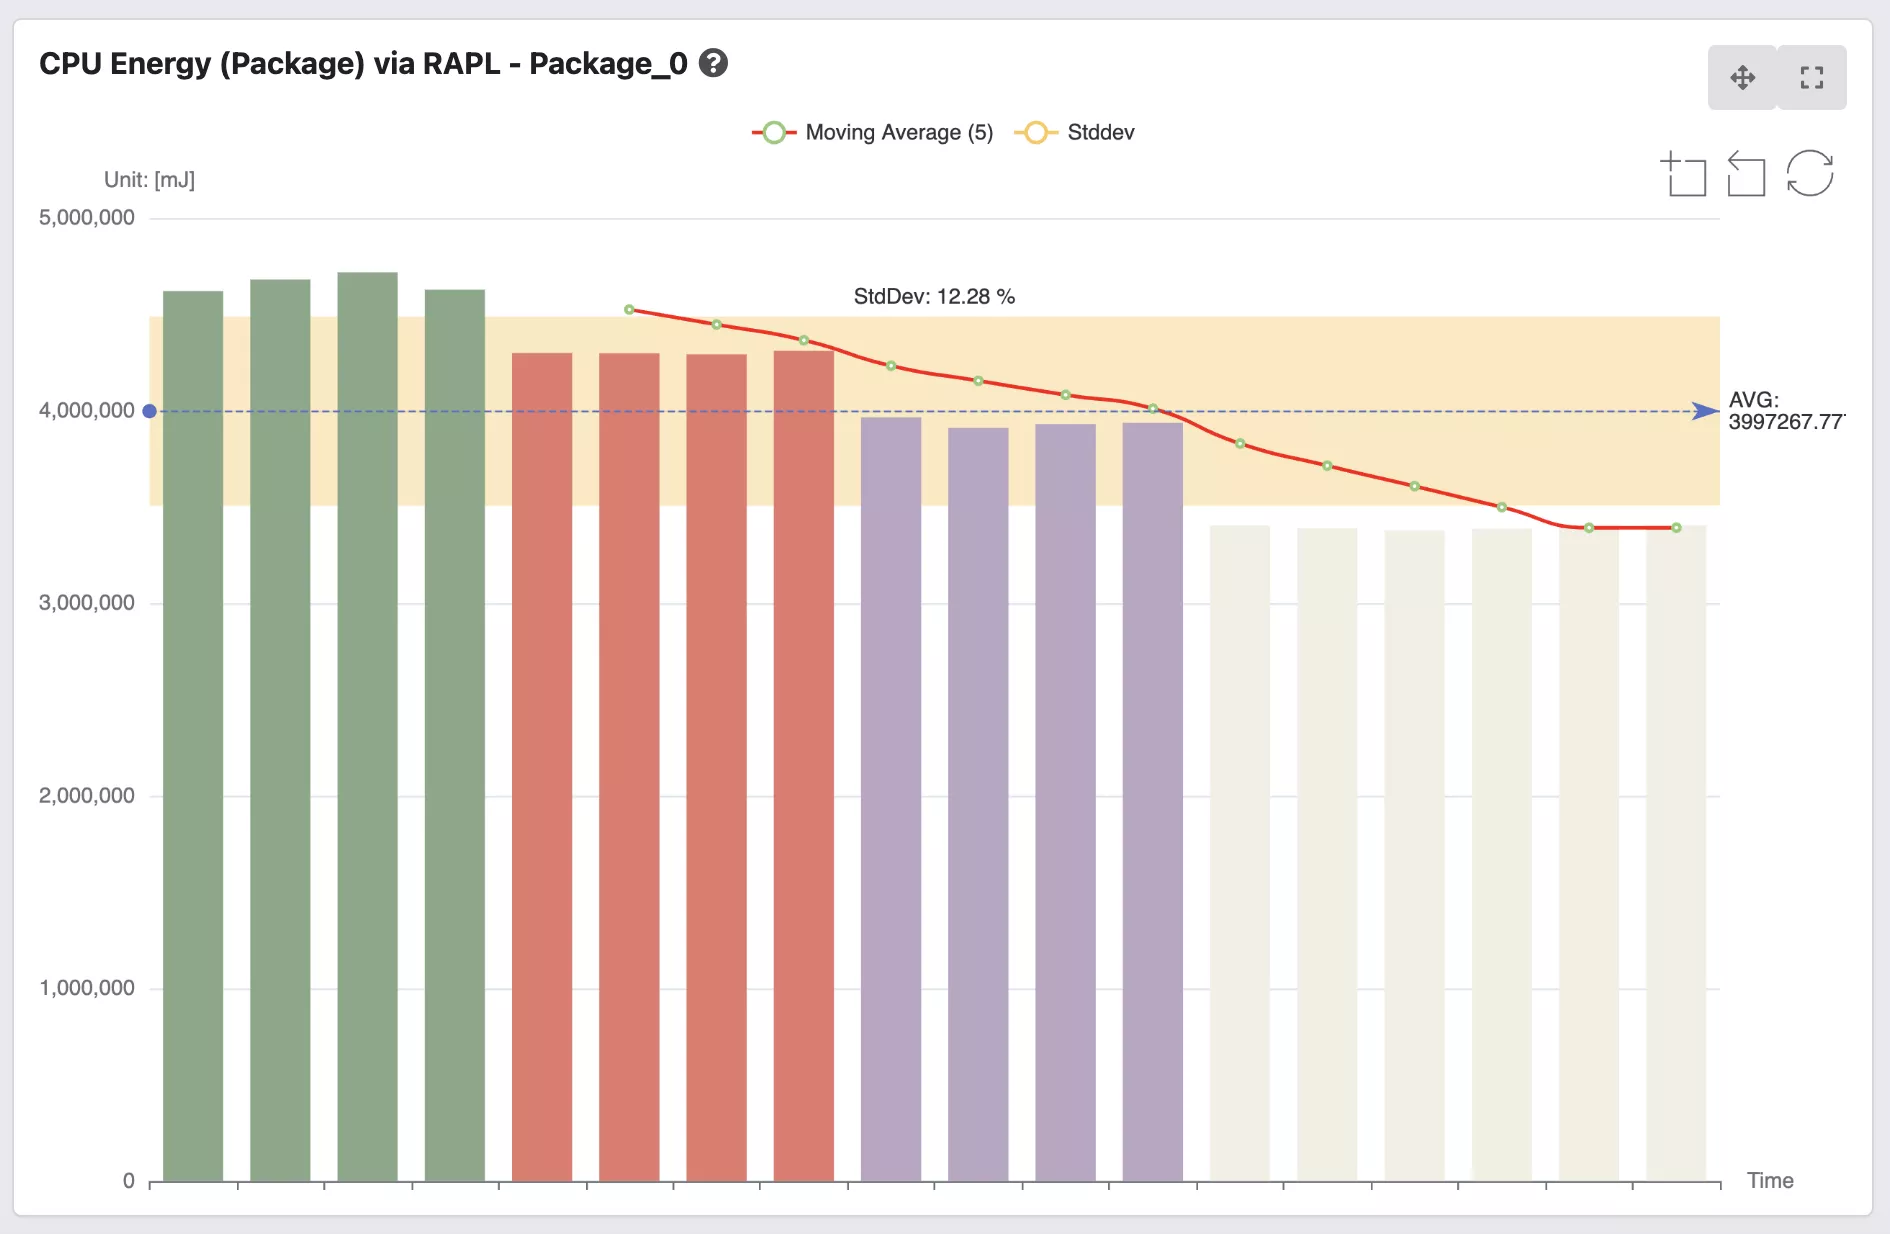
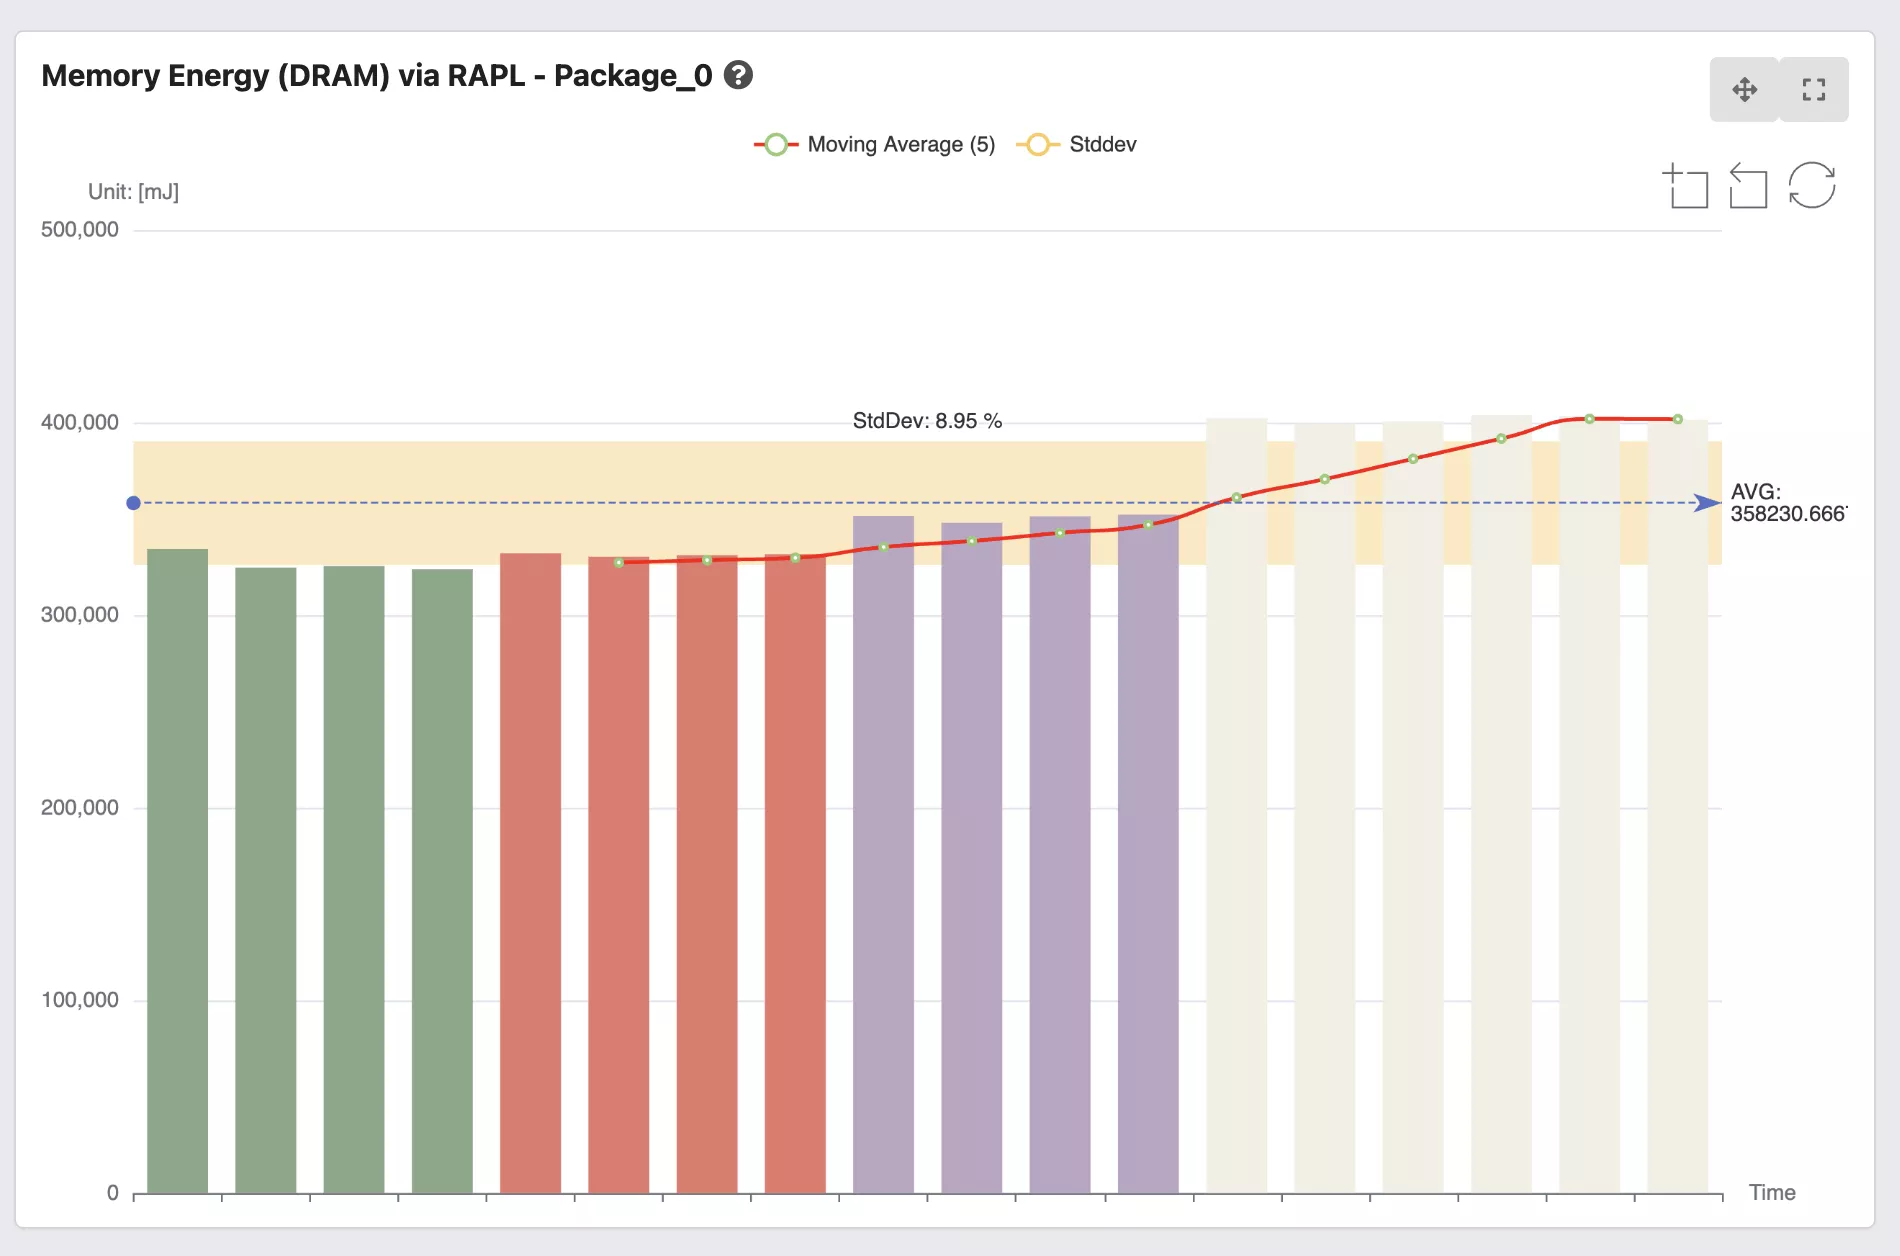
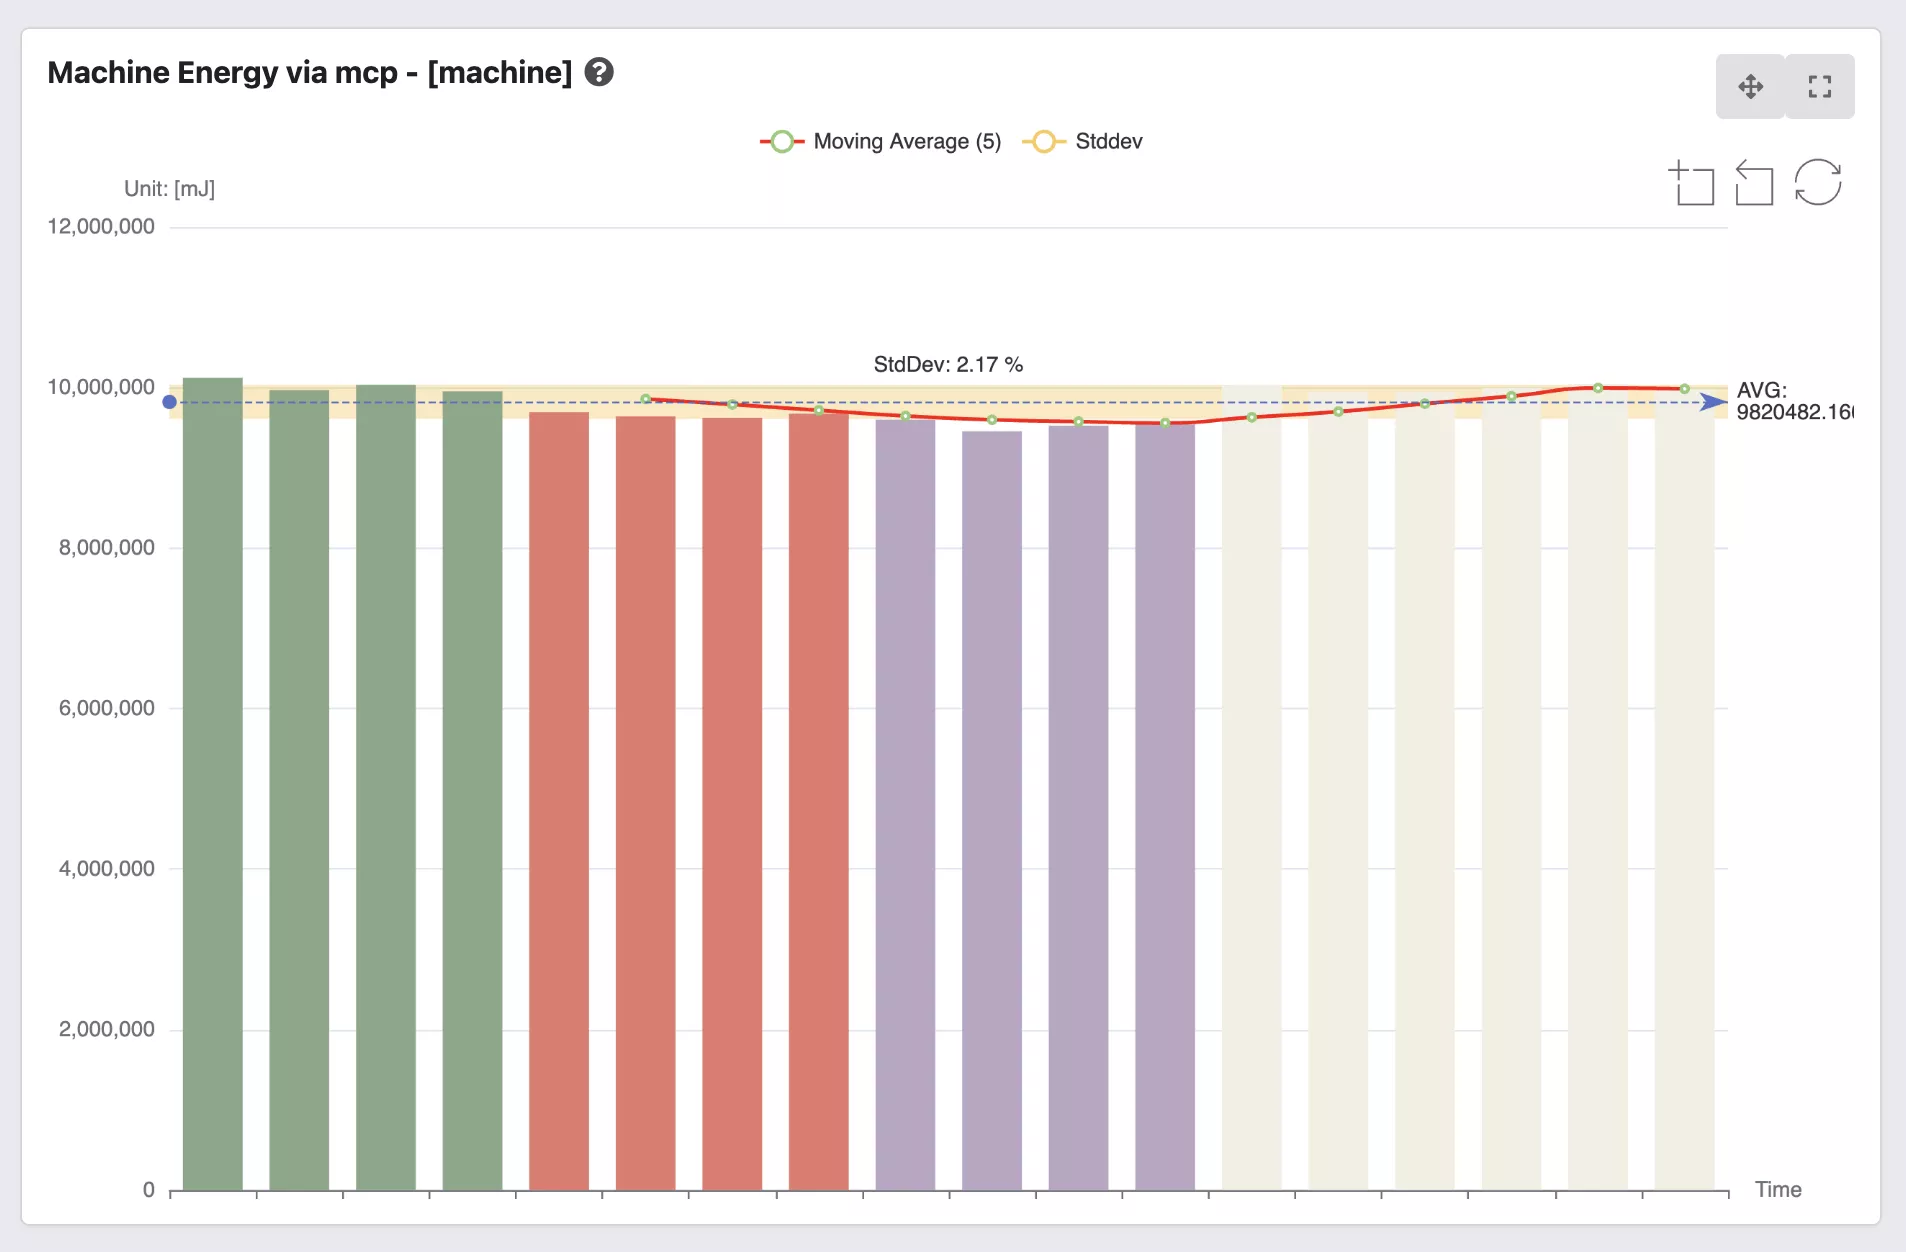
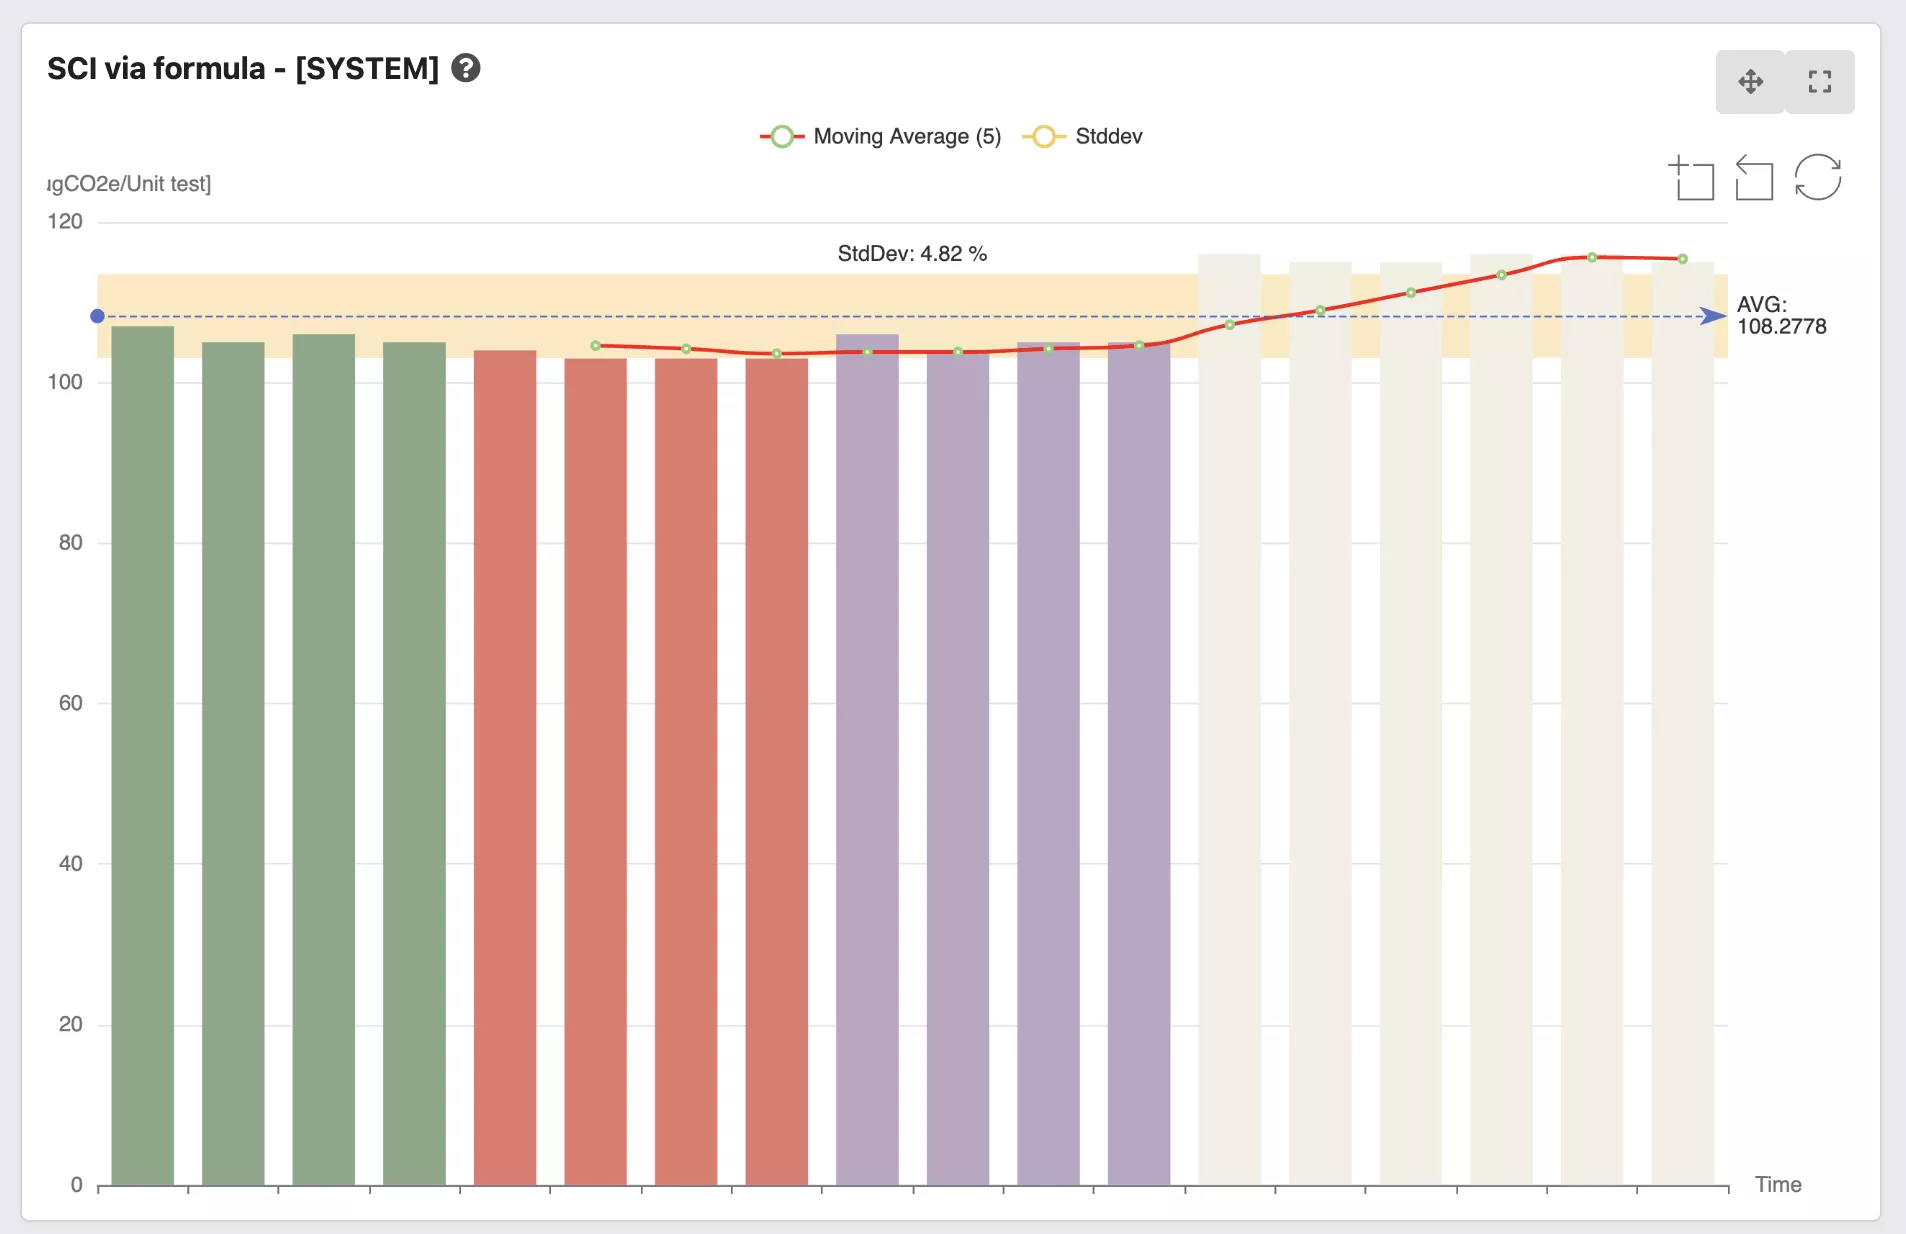
Power capping on Django Unit Tests - CPU Package EnergyPower capping on Django Unit Tests - DRAM EnergyPower capping on Django Unit Tests - Machine EnergyPower capping on Django Unit Tests - SCI
The different coloring in the charts show the different power cappings.
Green is 100%
Red is 80%
Violet is 60%
Beige is 40%
In the CPU Package Energy chart we see the same behaviour as in our synthetic benchmark. The optimium lies at around 40% for the CPU we are using.
However curiously the DRAM energy goes up. The reason for that is not known to us.
What is however easily explainable is that the machine energy goes up. Other components of the system like the mainboard, PSU, hard disks etc. also take energy while the CPU is computing and thus the gained energy for the CPU computes is consumed by the overhead cost of having these other components running.
The optimal operating point here shifts from 40% to 60%.
When we look even further and factor in the embodied carbon (through the Green Software Foundation’s SCI) we see that the operating point of the machine shifts again, now to 80%.
Summary and further considerations
In this case study we have looked at power capping and how employing it can drive the energy consumption of a component down. But we have also seen how the time for the compute goes up and how the quantify that drawback through looking at the total machine energy and the SCI value.
The case study shows how important it is to use tools that show a complete picture of the software and the optimizations you are trying to quantify. The Green Metrics Tool comes already with many of these metrics and can also be extended in a modular way.
One such extension could for instance be the cooling cost of the system that you are running.
We have seen that the operating point shifts more towards using less aggressive power capping the more auxillary components we integrate into our view. For the server that we are using we have reached the maximum scope, but servers that are in data centers typically also feature external cooling that must be factored in and having this running longer, because you power cap the workload might result in actually using an even less aggressive power capping than say 80%
Did we miss something? Or are you interested in also adding some measurements of your system? Please shoot us an email to info@green-coding.io