Software will always have carbon emissions. The same way that all technology, even solar power, has some carbon emissions and human life does too.
However we believe that using software is the way to be more green and more sustainable and digitalizing every sector is one building block to tackle climate change.
As with every technological domain measuring and understanding how much you use is the most important step to approach any task.
The next step is to understand the potentials for optimizations. Sometimes this are very low hangig fruits like green hosting.
Other times it involves changes to your infrastructure, your code or your development workflows.
The key step is to raise awareness and educate developers of energy consumption as one important building block to consider when design software architectures.
This will in turn increase the demand for the metrics and drive the supply by the industry players.
In order to do compute software needs to use the underlying hardware and will thus consume energy.
Energy consumption is often not straight forward. If you have CPU / GPU intensive loads like in High Performance Computing or in Bitcoin Mining then the energy use is often identical to the Thermal Design power of your chip.
In everday use of software the case is however very different. Many factors contribute to the often wasteful energy use of software and are often decoupled from the pure visual time we see a software running:
To make all of these separate domains visible to the developer we are creating open source tools to make the energy visible.
For user facing applications in the desktop, web and mobile world we are creating a tool to measure the whole application lifecycle based on the concept of a Standard Usage Scenario: The Green Metrics Tool
By pinning the code version and the usage scenario we can make different softwares comparable to each other.
In cloud environments of distributed architectures the use of a benchmarking tool is very cumbersome and not really useful.
Here in-line measurements that export to already existing observability solutions are needed and also look-ahead estimations that can drive architectural optimizations (like which service to use, or if a move to serverless is beneficial).
Through case-studies we also want to highlight the overhead cost of virtualization and give metrics to make informed decisions which architectural model fits best in an energy aware company culture.
Also check out our projects
When developing software also VMs are constantly spun up and down. In addition to that in a typical developing process software runs through a Continuous Integration (CI) Pipeline and all the tests are executed in full.
This process is often very opaque and the true cost hidden from the developer as it takes place in the cloud or on specialized SAAS platforms.
The understanding the cost of building software and the potential savings when batching the process or even splitting the Pipeline to only execute relevant parts can be tremendous.
As said before: Measuring is the first key to understanding, therefore our main focus here lies in the visiblity and education about the energy cost for developing software.
We develop in-line plugins for Github Actions and badges that make other people aware how much the build costs.
Also we focus in the building process for static sites, which typically have a lower cost of operating but incur a build cost.
Checkout out our OpenEnergyBadge project, our Eco CI-plugins for Github or our Case Studies on the topic.
Network transmissions are coming more and more into the focus as one of the main drivers of software carbon emissions.
Great tools like Websitecarbon.com allow the visiblity of the cost for a typical website request.
Nowadays this is typically done by boiling down the complexity into one very error prone formula. See our article on CO2-Formulas for more details.
The problematic in network emissions lies not in their existence, but in their invisibilty.
In the advent of the internet network transfer was typically metered. By introducing flatrates the internet increased its adoption and became ubiquitous.
However flatrates have introduced a decoupling from the nature of network transmissions not really having a flat carbon emission. This creates a disconnectedness and misunderstandig that every use of network will at some point lead to an increase in carbon emissions. Sometimes linearly, sometimes in stages. (See Gigabytes to kWh)
Since you do not see your consumption, like you for instance do for you telephone bill, you risk getting careless with the resource. Same as with buffet food, where leftovers are the norm.
The solution to this is, we believe, making this resource more visible and getting a more sustainable way of interacting with it.
We currently address this topic by educating developers through Meetups and through talks at conferences or coding bootcamps like WBS Coding School
On the technical site we highligh the network emissions in our Green Metrics Tool and show recommendations like
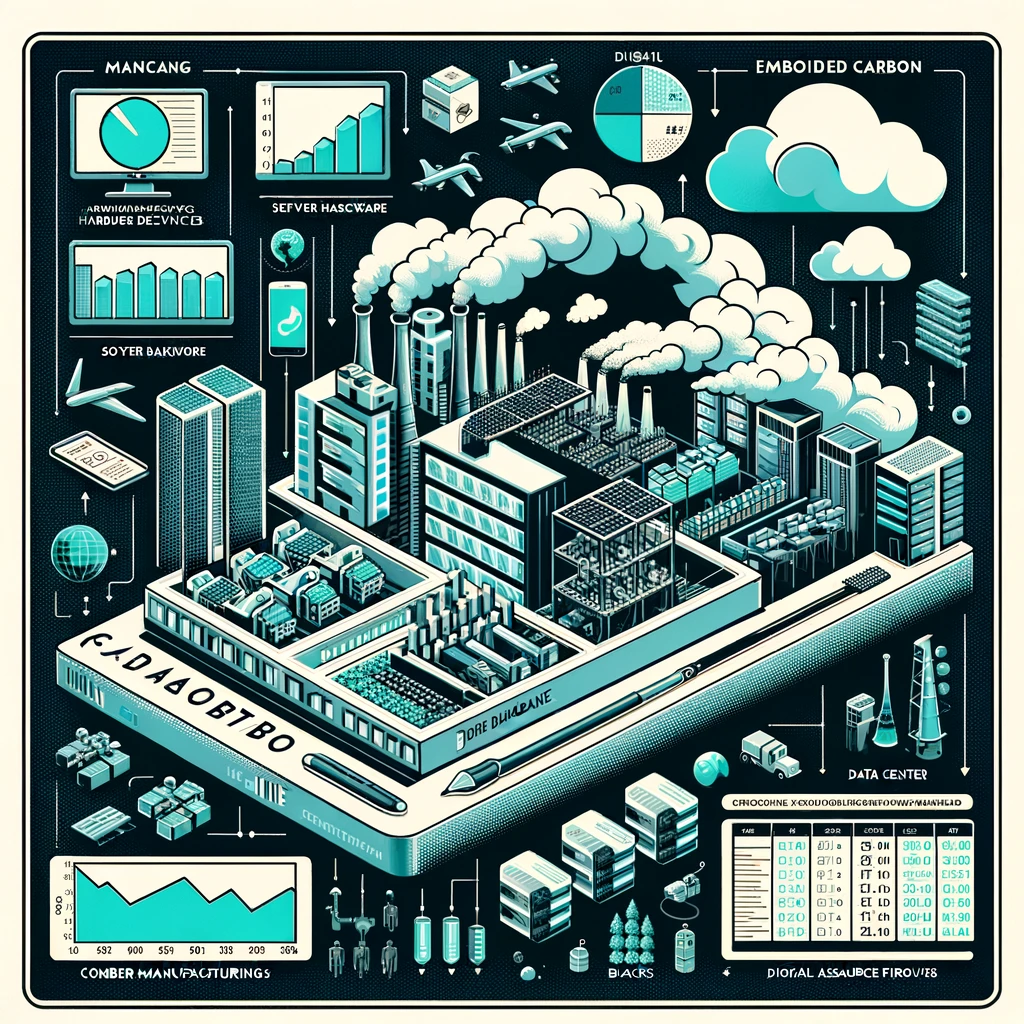
To run software you need hardware. That hardware has to be produced and often is the major driver of carbon emissions.
In consumer devices like Smartphones typically over 90% of the total carbon emissions come from the manufacturing
On servers this is a differnt deal, and here it is roughly the other way around (if you are not running on carbon free electricty).
We use official databases like the NegaOctet and Resilio from France / Switzerland to get the embodied carbon of the underlying hardware and showing the cost of manufactoring.
Another approach we we are adopting is the concept of Digital Resource Primitives, which is developed by the SDIA.
The concept effectively coins a resource as blocked, when it is used by software and thus can attribute the carbon impact from manufacturing to the time when it is used making software better comparable.