
Websites also do have carbon emissions. Like any other digital product that our society creates.
You might know already of other tools like Website Carbon Calculator, CO2.js, Cardamon or Firefox Profiler
We have thought it would be great to integrate both functionalities, measuring emissions based on network transfer AND emissions based on an actually measured device energy consumption, into an easily accessible, highly configurable and free and open source solution.
This post is about the background why we created it, the methodolgy and some suprising insights from benchmarking 100 popular websites.
If you want to try it out right now hop to the webNRG⚡️ website

The Background
We tend to think of websites in terms of speed and size. A page loads fast or slow; it weighs a few megabytes or dozens. Most sustainability tools like the Website Carbon Calculator look at a page’s network traffic. However, if we only look at data transfer, we are missing half the picture. Other that capturing the journey to the device, we also need to measure the costs of the work happening on the device.
So that is why we wanted to measure the part that we rarely see (or think about): The energy a device burns simply to display a website, which we think is a blind spot when it comes to reporting digital emissions of a website.
So what did we do? We developed a new tool called webNRG ☺ What we wanted webNRG to do was to essentially measure not only how “heavy” a webpage is (i.e. the data it transfers) but also how much power a computer consumes while rendering it.
With this tool, we proved what we had already assumed was true. That two websites with the same page weight can behave very differently once loaded.
What does webNRG do exactly?
When you load a page through the tool, it monitors the device’s energy draw as the browser processes scripts, paints frames, runs animations, and responds to background activity. In short, it measures the real-time energy required to actually display the website. [P.S. To our knowledge, we believe that only the Firefox Profiler offers something similar, however we feel that this is developed more for engineers. We wanted to make our tool accessible to the general public, but let us know if you have issues with the accessibility. After all, we are engineers and we may have our own blindspots. ☺]
webNRG also assigns a “nutri-score”-style grade so users and developers can compare sites at a glance.
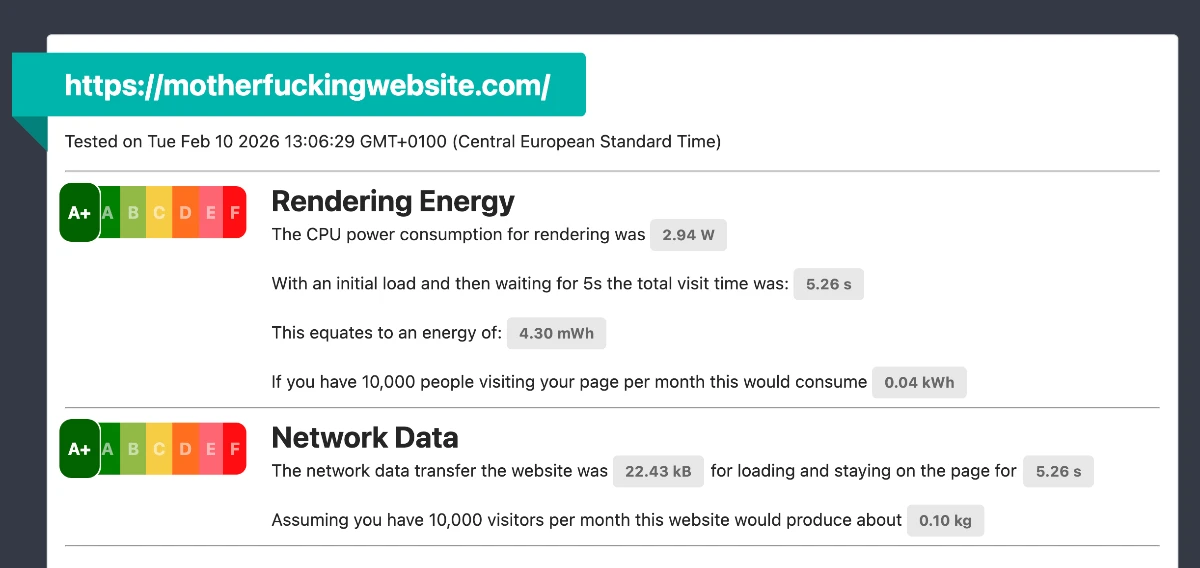
To generate the categories from A+ to F we use the idle power consumption of our measurement machine as capture by the Idle phase in the Green Metrics Tool. We then take the lowest power drawing page we could find (motherfuckingwebsite.com) as A+ and then linearly increment steps by 25% increase in rendering power. Everything above 2.5*Idle Power is considered F.
An A+ duration for loading the page we set to 500 ms. Furthermore to also capture the “viewing” of the page we wait for 5s after the initial load. The total energy consumption for this duo of initial load and 5s waiting is then used as the rendering energy.
The decision for 25%* was made because on our measurement system we see a 95p STDDEV of 0.2 W.
25%* of the idle power consumption equals 2.5x this STDDEV which is a typical way of determining a range for a statistical relevant difference (outlier) between categories / observations.
What our dataset shows so far
Looking beyond individual examples, early runs in our dataset show:
- Pure HTML pages often consume only 2.87–2.94 W, the lowest range we’ve observed.
- Repeated measurements of the same page remained extremely stable, varying by just 0.06 W, which is well within statistical noise.
- A page that transfers 35× more data than another can still consume the same rendering energy.
- Some small pages transfer under 1 MB but still require significantly more CPU energy, proving again that network size and rendering cost tell different stories.
Noteworthy insights from webNRG
To see what patterns might emerge, our team ran a batch of popular sites through webNRG. The results might surprise you! But first let’s start with insights that should surprise no one.
Minimalist HTML pages, such as the famously bare-bones motherfuckingwebsite.com (pardon our French), barely register above a systems idle power draw ( which is around 2.45 watts in our setup) and just draw ~2.94 W.
What you also typically would expect is a page that is high in page weight is also high in rendering energy (as downloading also takes CPU cyles) as we can see in the example of ZDF.de

And pages like the excellent opencloud.eu which has an A+ in rendering energy and also an A in page weight

And now for some insights that might surprise you!
The biggest energy consumers weren’t always the biggest pages.
Although a page can have a heavy page weight (www.zorginstituutnederland.nl) it can still fair quite well in rendering cost.

On the other hand not every page that has a horrible rendering power must be necessary high in page weight, like Pons.com

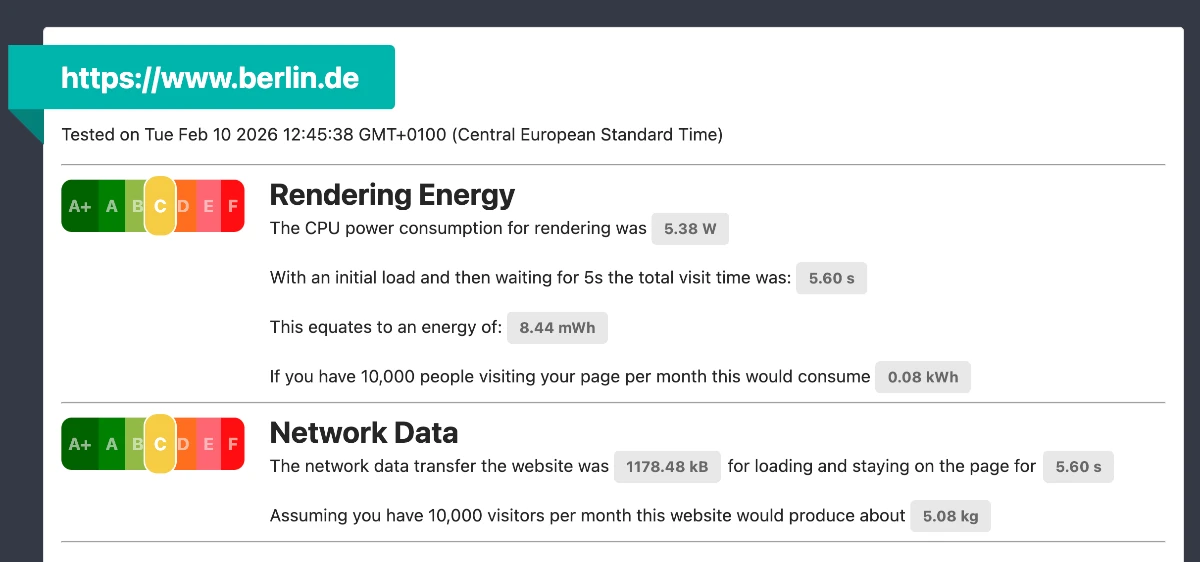
Even tiny pages can be unexpectedly power-hungry Berlin’s official city site (berlin.de) weighs just ~1.2 MB, yet its rendering energy landed well above average, around 5.35 watts. Continuous JavaScript and CSS activity appears to be the culprit, reminding us that megabytes alone don’t necessarily dictate efficiency.
Further insights on the data set:
- Across all sites, the average consumption hovered around 4.6 watts
- What we realised was that size and energy hardly correlate
- The correlation between page weight and rendering energy came in at 0.49, which is weak enough to show that one cannot reliably predict the other. A heavy site may be energy-thrifty; a light site may quietly hammer the CPU.
- Changes over time matter! In our data set pages constantly change. Some get better, but most get worse. The wildest one is ZDF.de, which had a very bad day on Nov 2nd 2025 and clocked in at 35 MB Download size with 9.16 W rendering power!!!
If you thought a smaller page was automatically greener, think again – with some help from webNRG to quantify your claims.
Why does this matter?
As our digital world expands, the footprint of everyday software grows with it. Websites have become full applications, and the work that happens inside the browser like constant scripting, background polling, video handling, animation carries a measurable energy cost.
For developers, designers, and companies, this introduces a new kind of performance insight: not just whether a page feels fast, but how much power it draws to function. It’s a metric that could influence everything from sustainable design guidelines to procurement standards to how organisations report on digital emissions.
What Comes Next
webNRG is now public, and the team is inviting people to explore and challenge the tool.
- Test your own website (and feel free to share your results whether it’s on LinkedIn or other platforms).
- Compare it to your competitors’ website
- As we are constantly looking to refine our tool, please also let us know if you sense that something seems off.
And good news! We are also launching a beta programme for organisations that want continuous monitoring. The idea is simple: track how a website’s energy consumption evolves over time and catch energy-hungry features as soon as they appear.
Furhthermore we will release some samples about how to create SCI scores with webNRG easily for your websites based on simple page loads, customer-journeys through your webpage or even complex web app interactions. Stay tuned!
So play around with it! Your curiosity improves the entire ecosystem and helps push the web towards a future where sustainability isn’t an afterthought but a standard.