
In this article I want to propose a simple way to do a Software Life Cycle Assessment for a piece of code. While explaining important concepts and tradeoffs that seem sensible for a little project. Of course things could be done differently and I am happy to discuss them in more detail as this is just a first draft of how things could be done. Please head to https://github.com/green-coding-solutions/SLCA-Code for all source code and discussions. Please also feel free to contribute to the code through pull requests. As Green Coding Solutions we have been working on this topic for some time and a more academic discussion can be found in our chapter in the Transparency for Software Climate Impact publication (Part of the Shaping Digital Transformation for a Sustainable Society publication).
Software Life Cycle Assessment (SLCA) is a topic that is talked about more and more. While Life Cycle Assessment (LCA) is fairly established in the realm of physical things. There are still various discussions in the software space though. In ISO 14040 and 14044 LCA is defined as the following:
LCA studies the environmental aspects and potential impacts throughout a product’s life cycle from raw materials acquisition through production, use and disposal. The general categories of environmental impacts needing consideration include resource use, human health, and ecological consequences.
When searching for SLCA the results are mainly on software to do LCA for products and not on how to evaluate a piece of software. Here a definition on how I see it for the sake of this article:
Software Life Cycle Assessment (SLCA) is a process of evaluating the environmental impact of software products throughout their entire life cycle. It involves analysing the different phases of: software development, deployment, usage, and disposal to identify potential environmental impacts and sustainability issues. SLCA is essential for organisations that aim to reduce their carbon footprint and promote sustainable software development practices.
This maps quite nicely to the distinct phases defined in classical life cycle assessments.
| Classic | New |
|---|---|
| Material acquisition and preprocessing | Libraries/ Software/ Embodied carbon |
| Production | Development |
| Distribution and storage | Deployment |
| Use | Servers/ Cloud/ Browsers/ Apps etc |
| End of life | Uninstall |
Software has become a ubiquitous part of modern life, with virtually every industry relying on software products or systems to operate. However, the production, deployment, use, and disposal of software can have significant environmental impacts, such as contributing to climate change, resource depletion, and pollution. SLCA provides a framework for assessing these impacts and identifying opportunities for improvement.
While there are various great frameworks to do SLCA on projects like the ISO or GHG ICT Sector Guidance these are overly complex and don’t reflect the way software is developed today.
Modern day software is continuously developed, hosted in source control, continuously tested and deployed on machines one does not know the exact location or setup. There is also no reasonable way for me to figure out simple things as how much memory my application is using at any given moment. Mostly I don’t know my users when creating a simple app. I don’t know what type of hardware they are using. It makes a huge difference for example if someone is using a modern LED Display or an old beamer to use my code.
While these are all great options I wanted something easier I can apply in my daily coding. While I want to reduce the impact of the software I write, I still actually want to write software and not spend my time doing things like Goal Definition, Life Cycle Inventory, Impact Assessment and only some Assessment.
Libraries
Modern software development is unimaginable without the use of multiple libraries to sometimes to the simplest things. Obviously it would be nice to see the impact the development of these libraries has had or is still having but this is currently not possible and will be discussed in another article. Also the embodied carbon for the existing hardware should be taken into account. This will also be discussed in another article.
Development Phase
This is probably the phase the least information is available about when doing research. The ICT Sector Guidance even specifically states that:
In most cases, the “embodied emissions” (all stages excluding the use stage) of software are not significant compared with the overall emissions of the ICT system, particularly when the embodied emissions caused by development of the software are amortized over a large number of copies Page 6.6
Personally I have to disagree. I am quite aware that my development activity produces a lot of environmental impact. Just considering the tower PC with the two screens attached and the various online services I use that I sometimes don’t power down when I go to lunch, which I use for my Linux related development. Or thinking about intensive DevOps or re-optimizations of AI models, which seem to be the norm in modern software products rather than the exception. Also if you think about all the software products that never reach a relevant audience or are prototypes and never reach production this cost would be totally neglected … the list goes on and on …
So I wanted to measure this.
Starting with the most obvious: My development machine. I was quite astonished to realise there is no out of the box solution that I can just install and get a nice summary of the energy used for various tasks over time with nice drilldown etc. So I decided to keep it simple and just assume when my work computer is on I am doing work things and that everything the computer does is related to the project I am currently working on. It is debatable that if Spotify, which is one of the biggest energy consumers, should really be counted to the development of a web project. But I am listing to music while developing so I would argue that it should count. The same goes for Slack, Mail etc. it is currently unrealistic that I can account the energy usage of each email to the various projects I am working on. So to make things simple: If the computer is on everything is counted towards the main project I am working on. We are currently specking out how this could be solved more finer grain. Unfortunately Linux doesn’t really offer any tools that support energy measurements on a per process level. There are some implementations that use cpu utilisation to split the power, but as discussed in the “CPU UTILIZATION - A USEFUL METRIC” article this is sometimes misleading. As also part of this work was done while travelling I developed the code on my M1 Macbook Pro. Because of this I can use the powermetrics tool we use when benchmarking software on MacOS which gives me a sort of power measurement through the energy impact value. This is a closed source implementation by Apple but some details are known and exposed in this article by Mozilla for instance. While being far from perfect this value gives you a first impact estimate for each process.
I wrote this little script which saves power statistics into a file to be later consumed. I had this running as a service and then did some hand crafted awk/sed magic to parse the file. This is not really useful except for personal use in a more explanatory usage. But in the end I want to be able to see how much time everyone has spend on the tool so I need some sort of upload functionality. Also I would want some dynamic badge that I could add the the README.md so people can see the impact this software has created to date, as most software development is ongoing.
Note: This work has lead to the develop of a energy logger for MacOS called the HOG. Details can be found unter https://github.com/green-coding-solutions/hog
Local Data Logger
The code here is only an example. Detailed code can be found in the hog GitHub repo.
import json
import subprocess
import time
import threading
import plistlib
import uuid
import argparse
from datetime import timezone
from queue import Queue
from pathlib import Path
from AppKit import NSScreen

APP_NAME = "gcs_power_logger"
app_support_path = Path.home() / 'Library' / 'Application Support' / APP_NAME
app_support_path.mkdir(parents=True, exist_ok=True)

OUTPUT_FILE = app_support_path / 'logger.txt'
STATUS_FILE = app_support_path / 'project.txt'

# You will need to update you screen_energy in joules for your external screen
# one minute pm interval and process every 5 minutes
SETTINGS = {
    'powermetrics' : 60000,
    'loop_sleep': 300,
    'screen_energy': 18
}

def is_external_monitor_connected():
    screens = NSScreen.screens()
    return len(screens) > 1

def run_powermetrics(queue):
    cmd = ['powermetrics',
           '--samplers', 'cpu_power,gpu_power,ane_power',
           '-i', str(SETTINGS['powermetrics']),
           '-f', 'plist']
    process = subprocess.Popen(cmd, stdout=subprocess.PIPE, stderr=subprocess.STDOUT, text=True)

    for line in process.stdout:
        queue.put(line)

def parse_powermetrics_output(output):
    with open(OUTPUT_FILE, 'a') as output_file:
        for data in output.encode('utf-8').split(b'\x00'):
            if data:
                try:
                    with open(STATUS_FILE, 'r') as file:
                        project = file.readline().strip()
                except FileNotFoundError:
                    project = ''

                data=plistlib.loads(data)
                json_output = json.dumps({
                    'time': int(data['timestamp'].replace(tzinfo=timezone.utc).timestamp() * 1e9),
                    'node': uuid.getnode(),
                    'combined_power': data['processor'].get('combined_power', 0),
                    'cpu_energy': data['processor'].get('cpu_energy', 0),
                    'gpu_energy': data['processor'].get('gpu_energy', 0),
                    'ane_energy': data['processor'].get('ane_energy', 0),
                    'time_delta': str(SETTINGS['powermetrics']),
                    'screen_energy': SETTINGS['screen_energy'] if is_external_monitor_connected() else 0,
                    'project': project,
                    'type': 'development.user.pc', #stage.who.hardware
                })
                output_file.write(json_output + '\n')

def main():
    output_queue = Queue()

    # Start powermetrics in a separate thread
    powermetrics_thread = threading.Thread(target=run_powermetrics, args=(output_queue,))
    powermetrics_thread.daemon = True
    powermetrics_thread.start()

    while True:
        raw_output = ''
        time.sleep(SETTINGS['loop_sleep'])
        while not output_queue.empty():
            raw_output += output_queue.get()

        if raw_output:
            parse_powermetrics_output(raw_output)

if __name__ == '__main__':
    parser = argparse.ArgumentParser(description=
                                     """A simple energy measurement program using powermetrics""")
    parser.add_argument('-d', '--debug', action='store_true', help='Enable debug mode')
    args = parser.parse_args()
    if args.debug:
        SETTINGS = { 'powermetrics' : 500, 'loop_sleep': 2, 'screen_energy': 18 }

    main()
This is a simple program that logs the energy usage to a text file periodically. It also checks if there is an external screen connected and uses a fixed energy constant. This obviously does not reflect the actual energy usage but most people will not connect an energy meter to their external monitor so this value from the data sheet will suffice and in our energy meter control measurements the monitor at least proved to have a constant power draw given you don’t change any settings. Now we should have a fairly good understanding of how much energy we are locally using. It is important to note that there is no real way to estimate how much services like GitHub Copilot use. We will be proposing a solution to this problem later on in the Extra Features chapter. Also there is the option to set a project string to identify the project you are working on. Please check the GitHub repo for little shell scripts that handle the setting of project strings.
Software Carbon Database
We now want to implement a simple server that has three main functionalities:
- Accept json strings and save them into a database
- Return the last timestamp when given a user_id so we can only transmit the values that haven’t been saved.
- Render a little badge for the project how much energy it has incurred to date
This is a highly simplified version and the server will not include any security features in this first version. The details of the server are covered in the Carbon Aware Development article which is complementary to this one. So you can switch over to the other article and then return here.
Because the data logger was running while I developed the server I can now see exactly how much energy this has taken. These values are meant only as an example as there was also a lot of other development and benchmarks going on.
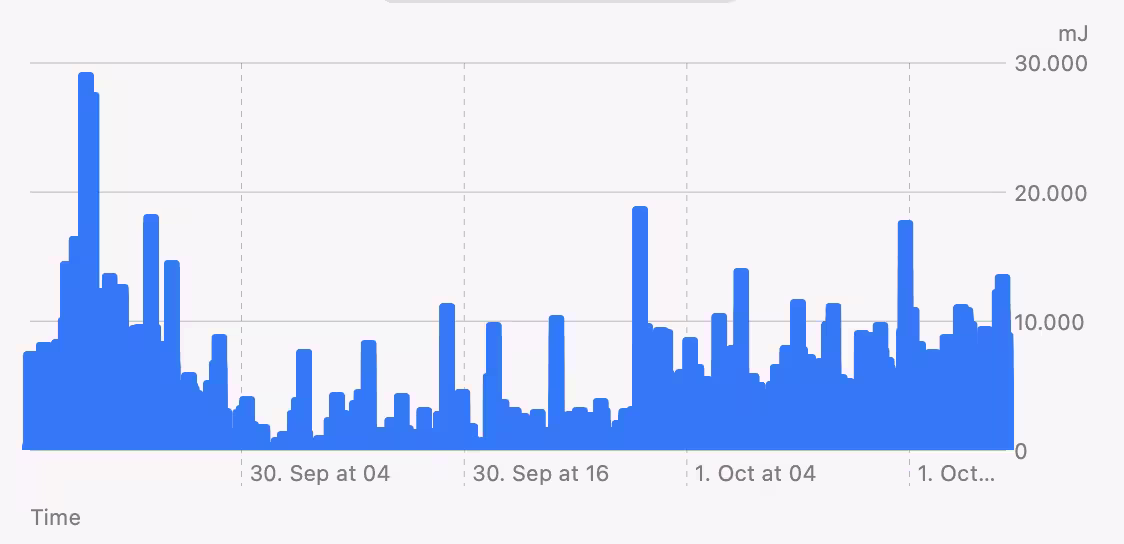
The idea behind the server is that when doing a software life cycle assessment there needs to be one place where all the values are saved that need to be accounted to the project. As there is no such thing to date and we need it anyway this is a good example to show the main concepts.
I can now also see how much energy the project has summed up: 9.57 Watt hours
So now we know exactly how much resources, in this case energy, was consumed to develop our little backend server. And as software is ever evolving we can track how much we continue to accumulate over time. The server even gives you a little badge you can include in your README page.
Currently it is impossible to know how much carbon impact a certain pice of code has produced. Through having a standardised database format it will become possible to account for all aspects of the development lifecycle. Our Software Carbon Database is only the first step and a proof of concept that such a solution is fairly easy to develop and not too far into the future.
Deployment
The next step in Software Life Cycle Assessment is the deployment of our little server. Because we use the Green Metrics Tool for Carbon Aware Development we can just check the Installation phase and see how much energy the deployment will take.
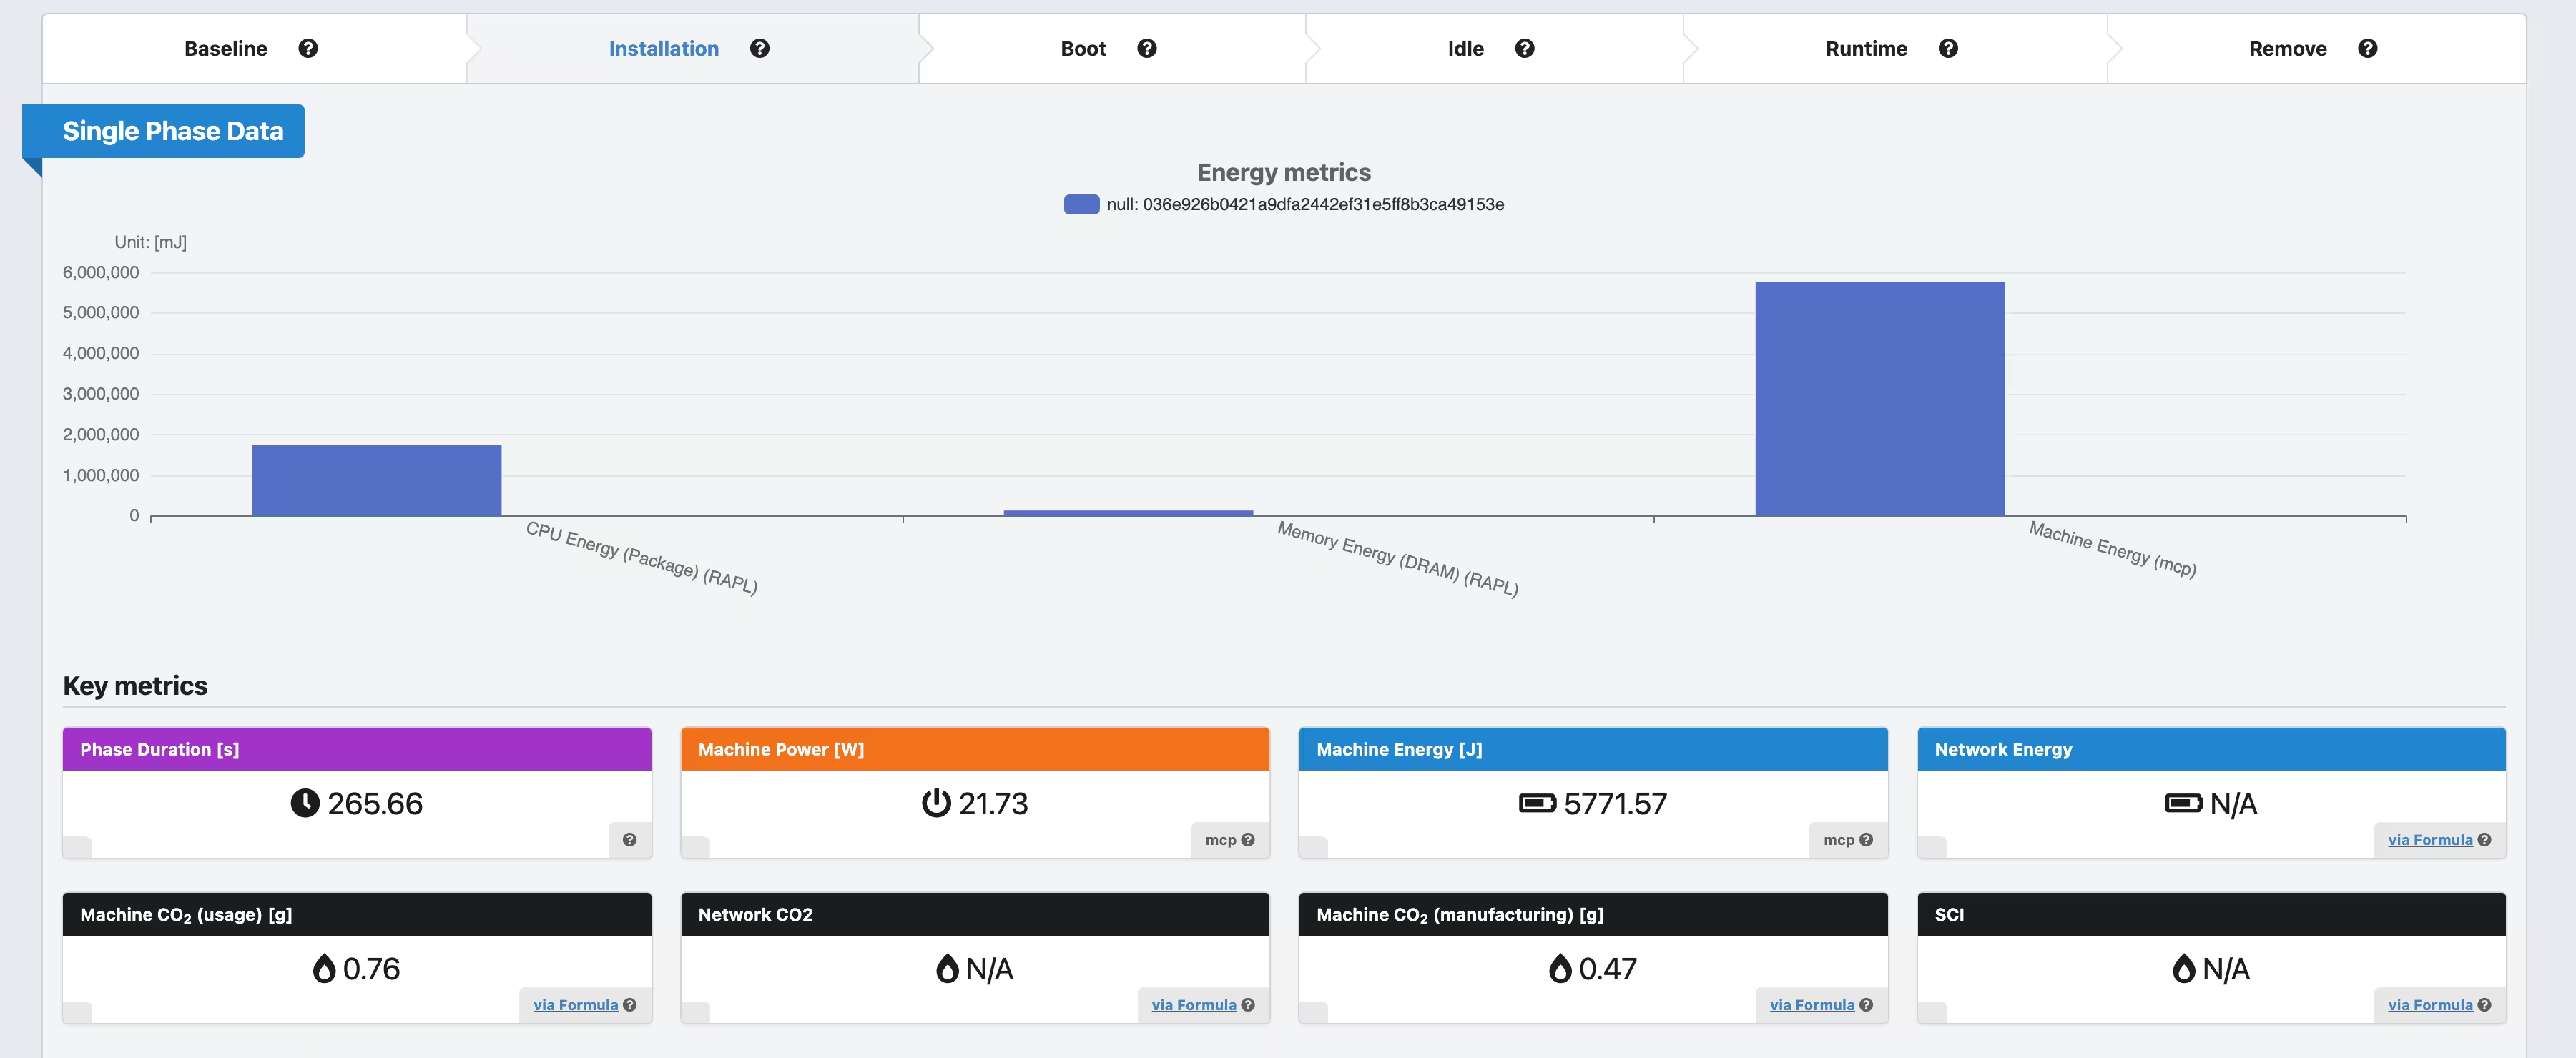
In this case 5771.57 Joule - Link to Detailed Measurement
This is not taking into account adding things to a CDN or complex deployments. In this case we are just looking at a docker build and python package installs. While not perfect this is a quite good approximation.
Usage
Now we need to estimate or calculate the usage phase of our software. While most frameworks use a static calculation of the usage impact this does not reflect the reality anymore. It is very hard to estimate how much a piece of software will be used and how things will change in the future. With modern software being updated multiple times a day sometimes completely automated. So we need to figure out a new methodology how to measure energy usage in complex software systems. As I have no idea how much the server will be used and on what hardware it will be deployed I can not really know how much resources the usage will use.
Using the setup from the Carbon Aware Programming article I do know how much each query consumes in the whole setup with database and web-server as I use these values to evaluate my programming decisions. So I can extend the server script to report on the energy values for each query. I am aware that this is neglecting embodied carbon, for now, but this is down to the fact that we are currently working on this feature for the Green Metrics Tool. Once we have implemented it we can also add the embodied carbon to our Software Carbon Database.
Running the GMT to see how much energy each endpoint uses I get the following values:
/save : 0.0502 J
/last_time: 0.024755 J
/badge: 0.050715 J
Currently it is still needed to get these values from the DB by hand but we will add this functionality in the future to the GMT. These values include everything that is needed to serve this query like DB, networking and caching. Obviously it is specific to the architecture I run on but these are actual energy values per query. Here, as we consume the docker-compose.yml file we actually build a complete system like it will be deployed and used. As we now have the detailed metrics we can build a middleware that exposes these values per API call.
energy_stats_joule = {
    'save': 0.0502,
    'last_time': 0.024755,
    'badge': 0.050715
}

@app.middleware("http")
async def add_process_time_header(request: Request, call_next):
    request_energy = 0
    if 'x-self-energy-accounting' not in request.headers:
            for k,v in energy_stats_joule.items():
                if k in request.url.path:
                    request_energy = v
                    logger.info(json.dumps({
                        'time': int(time.time() * 1000),
                        'node': uuid.getnode(),
                        'request_energy': request_energy,
                        'project': 'slca',
                        'type': 'usage.server.server', #stage.who.hardware
                    }))
    response = await call_next(request)
    response.headers["x-energy-joule"] = str(request_energy)
    return response
This is a very simple middleware that enables us to track the energy usage of our server in real time. In modern settings docker containers are run on a multitude of setups and in most cases I don’t even know where they are deployed. By abstracting the measurement and making it part of the deployment process we can monitor our app without any performance penalties. In a more complex app we would separate the stats into a separate file and automatically populate them on deploy.
As you can see from the code the middleware serves two purposes.
- It adds the
x-energy-jouleresponse http header. This reports how much energy this one query needed to serve the request. All parts of the software are included here. The server is seen as a black box that gets a query and then returns a value that needednresources. This is particularly interesting and needed if you want to do proper accounting. I would love to know how much resources my GitHub repository uses but currently there is no way of knowing. - The middle ware also introduces the
x-self-energy-accountinghttp header on receiving the request. When reporting energy especially with the goal to account for impact in respect to a piece of software it is important to avoid double counting. So when the client sets this header the server does not account for the resources but assumes the client will do this on her own. - On every api query, if the client doesn’t do the accounting, the server will output the used energy to the logger. We then have a tasks that periodically scrapes all the logs and adds the energy to our Software Carbon Database hence continuously updates the actual resource usage of my server.
Now we have a solution in which we can do Software Life Cycle Assessment continuously and actually relies on real life and verified values that can be traced.
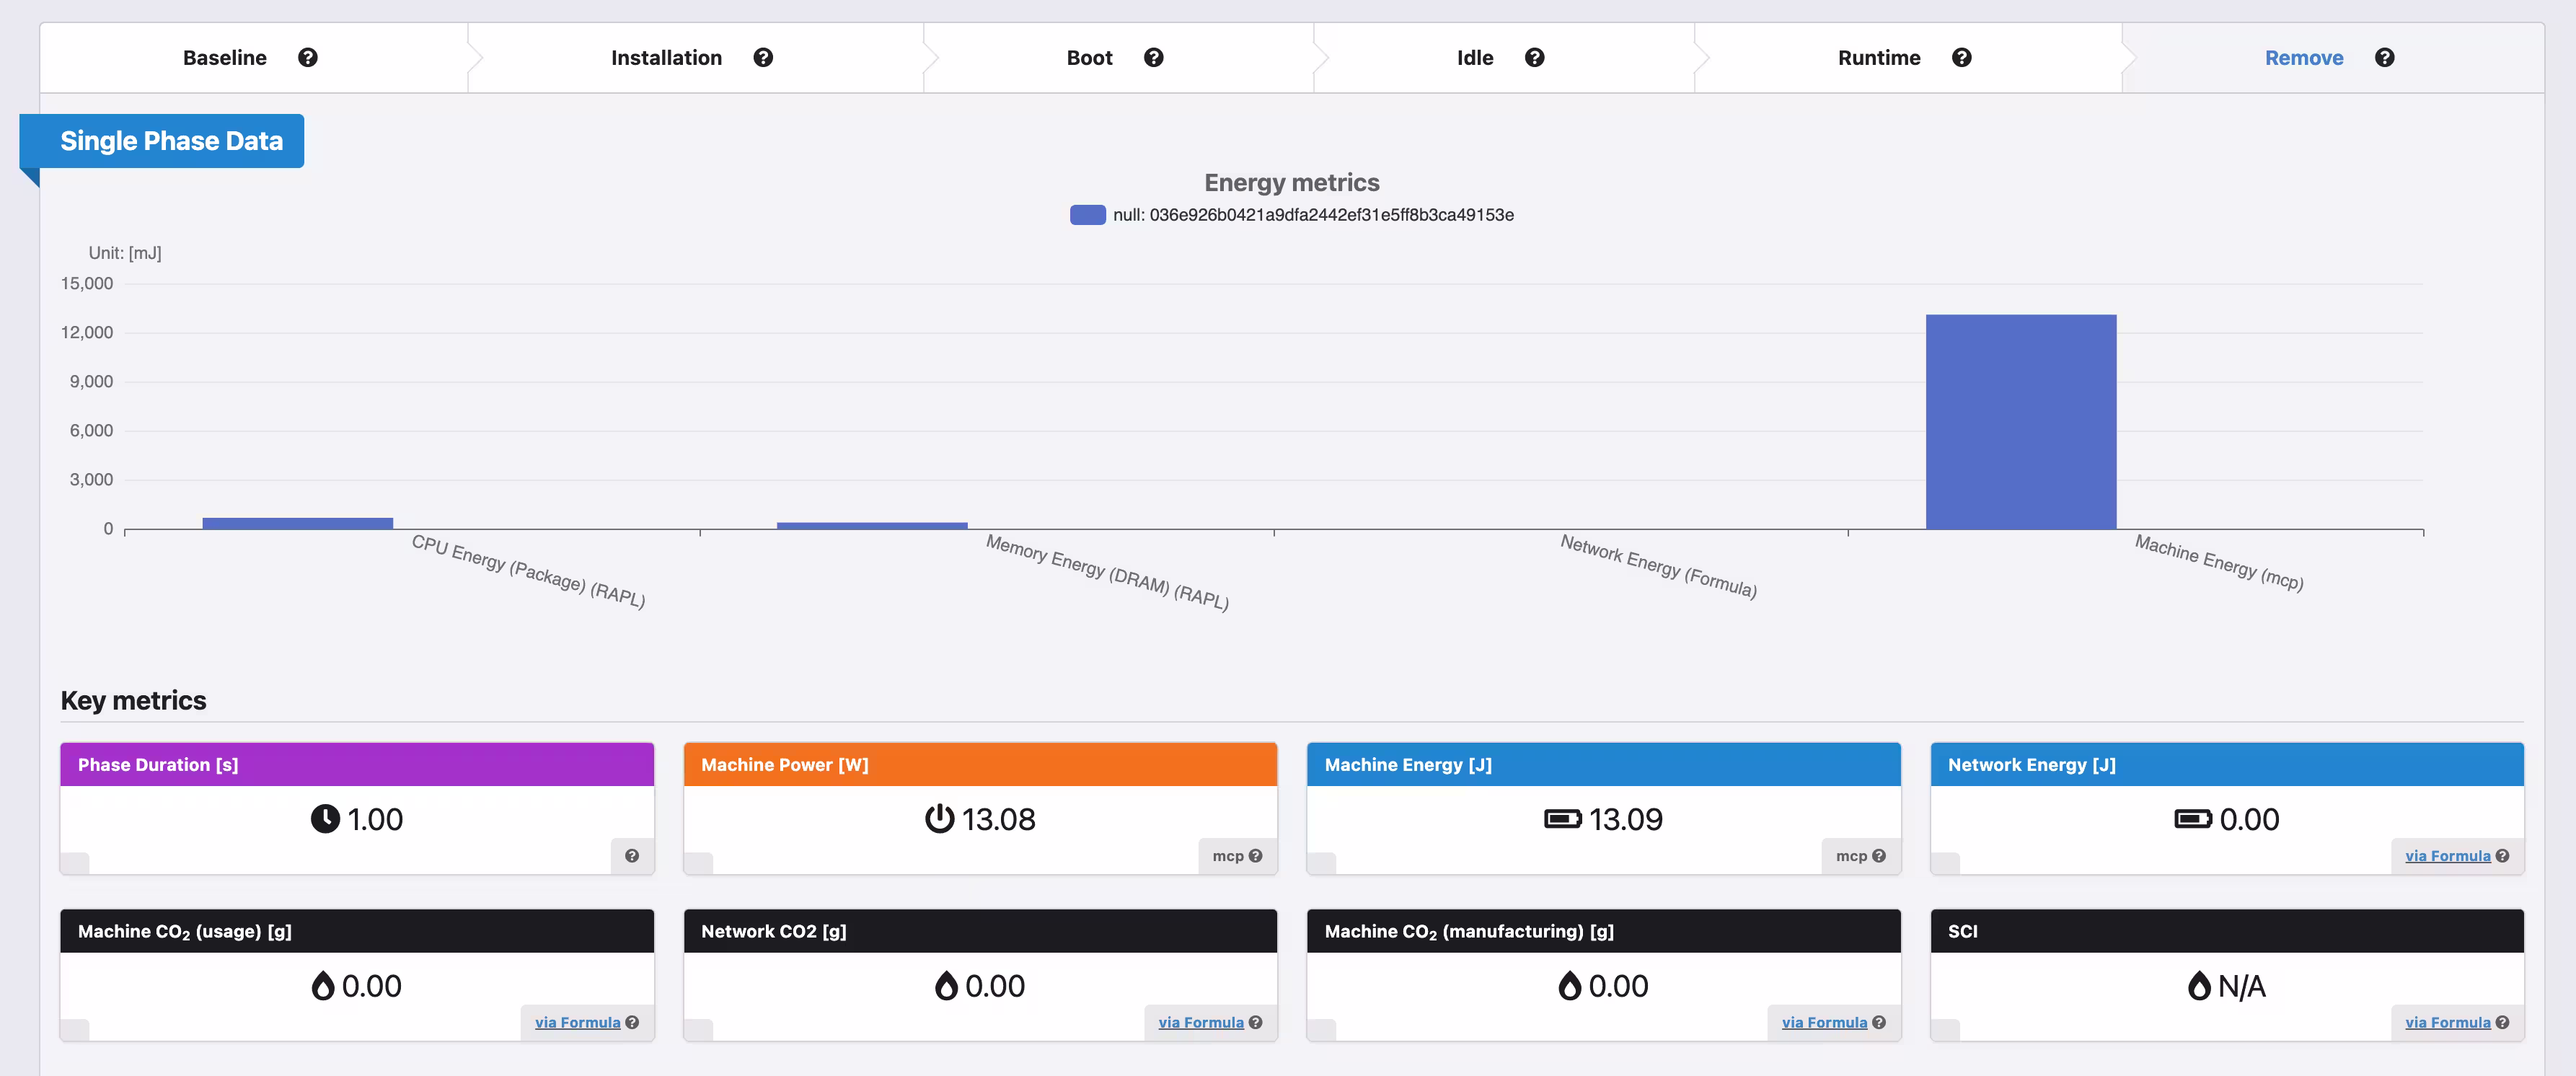
Disposal
The Green Metrics tool has a special phase in which we measure the remove steps of a particular software. For the server this is 13.09 Joule. So we can report this into the carbon DB.
Conclusion
With this article we have shown a simple modern approach to Software Life Cycle Assessment which reflects the way software is developed and used today. It also acknowledges that software is always in development and the requirements are ever changing. This way of accounting doesn’t create a huge overhead and is totally manageable on a daily bases with most of the steps being automatable. It can easily be adopted by teams. Also it tries to take real life values and not just assume some more or less random values.
This is ongoing work so please check and contribute to the discussion on GitHub https://github.com/green-coding-solutions/SLCA-Code/tree/main