
The Green Metrics Tool (GMT) has long supported automated generation of the Software Carbon Intensity (SCI) metric — the Green Software Foundation’s standard for expressing carbon emissions per unit of useful work. With the latest release, we have introduced Custom Metrics with per-phase SCI support, enabling developers to not just obtain a single SCI score for an entire benchmark run, but to decompose that score across the individual execution phases of their application.
This post explains what that means technically, why it matters for software engineers who care about carbon accounting precision, and how to integrate it into your own measurement scenarios.
The Problem: A Single SCI Score Obscures Where Carbon Comes From
The SCI formula — SCI = (E * I + M) / R — expresses carbon per functional unit R. In the GMT, an automated run of a software system is structured into discrete measurement phases: typically a boot phase, a setup phase, a runtime phase, and a teardown phase. Until now, the SCI score surfaced in the dashboard was aggregated across the entire run and reported only once — at the RUNTIME phase level.
This is adequate for comparing two software versions against each other or for publishing a top-level carbon score. However, it provides no granularity into which part of your application’s lifecycle is driving carbon costs. Is the database initialisation heavier than the core request processing? Is teardown surprisingly expensive? A single aggregate SCI cannot answer these questions.
The Solution: Custom Metrics with sci: True
The new Custom Metrics feature extends the GMT’s measurement pipeline by allowing you to declare arbitrary metrics derived from your software’s standard output, and — crucially — flag any of them with sci: True. When this flag is set, the GMT automatically computes a gCO2e/<unit> metric for every phase in which that custom metric appears.
The configuration is split across two files, keeping machine-level constants separate from scenario-level definitions.
Declaring the custom metric in usage_scenario.yml
The unit of work R is extracted from the STDOUT of any process running inside a measurement container. The snippet below illustrates a CPU benchmark that emits the count of calculated prime numbers:
name: SCI Phase Test
author: A wizard
description: Per-phase SCI measurement example

services:
  gcb-alpine-sysbench:
    image: alpine
    setup-commands:
      - command: apk add sysbench coreutils gawk

custom_metrics:
  calculated_prime_numbers:
    unit: CPN
    sci: true  # instructs GMT to produce a gCO2e/CPN metric per phase

flow:
  - name: Stress
    container: gcb-alpine-sysbench
    commands:
      - type: console
        note: Starting sysbench
        command: sysbench --cpu-max-prime=25000 --threads=1 --time=3 cpu run --debug=off | gawk '/total number of events:/ {cmd="date +%s%N"; cmd | getline ts; close(cmd); print ts " calculated_prime_numbers=" $NF}'
        shell: sh
The GMT parses any line from STDOUT matching the pattern <timestamp_ns> <metric_name>=<value> and associates the value with the corresponding measurement phase.
Alternatively you can also give it a custom regex. See more infos in the Custom Metrics and SCI documentation
Supplying machine constants in config.yml
The embodied carbon (M), grid intensity (I), machine share (RS), and expected lifetime (EL) are defined once at the machine level:
sci:
    EL: 4        # expected lifetime in years
    RS: 1        # resource share — 1.0 for bare-metal, <1.0 for virtualised instances
    TE: 181000   # total embodied carbon of the machine in gCO2e (source: Boavizta)
    I: 334       # grid carbon intensity in gCO2e/kWh (Germany, 2024)
These values are combined with the measured energy E — derived from an active PSU energy provider for machine energy and a Network IO provider for network energy — to produce the full SCI score for each phase in which R is observed.
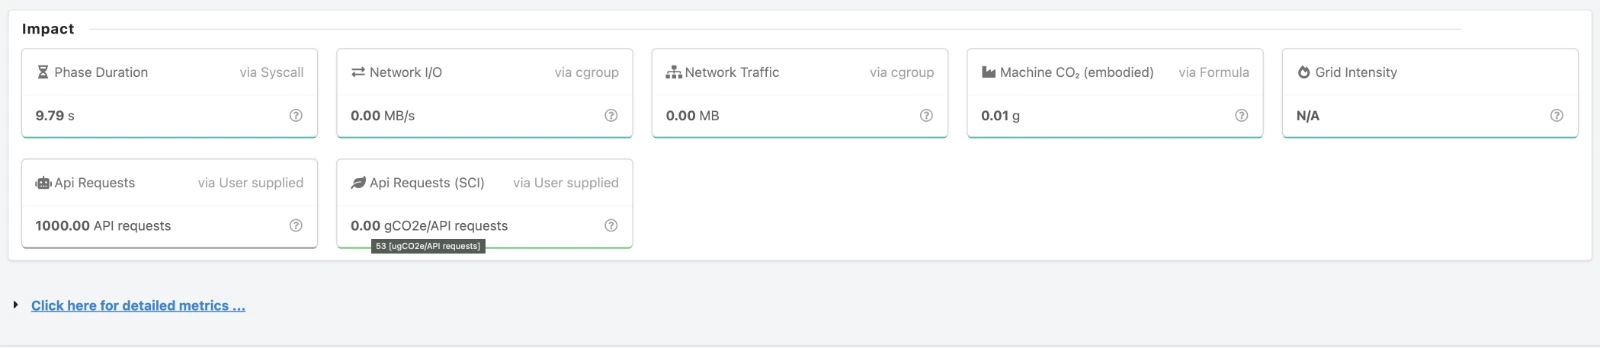
What the Dashboard Shows
Once a measurement run completes, the GMT dashboard renders the SCI metric broken out by phase. Each phase that captured at least one tick of the custom metric gets its own gCO2e/<unit> bar alongside the conventional energy and CPU metrics. The RUNTIME phase additionally shows the aggregated SCI across all phases, preserving backward compatibility with the single-score use case.
A dedicated Measurements Tab surfaces the raw SCI parameters (E, I, M, R) used in each phase’s calculation, making the derivation fully auditable and reproducible.
Why Phase-Level SCI Changes the Carbon Optimisation Loop
Attributing carbon to the right lifecycle stage
Many applications perform substantial work during initialisation — pulling container layers, warming caches, running database migrations. This work consumes energy and therefore carries a carbon cost, but it is amortised differently from the carbon incurred during steady-state request processing. Phase-level SCI makes this distinction explicit and measurable.
Identifying optimisation targets with confidence
When a developer reduces the SCI of their application by 15%, a single aggregate score cannot tell them whether the improvement came from a leaner boot sequence, a more efficient algorithm in the runtime path, or simply a quieter network connection during that particular run. Per-phase SCI provides the attribution needed to verify that an optimisation had the intended effect in the intended phase.
Comparing architectures at the phase level
Consider two API designs: one that pre-computes results during setup and serves them cheaply at runtime, and one that computes on demand. Their aggregate SCI scores might be similar, but their phase profiles will differ substantially. Phase-level SCI exposes this trade-off in carbon terms directly.
Enabling carbon-aware CI/CD gates
Because the GMT integrates with standard DevOps infrastructure via Docker Compose files and Git repositories, per-phase SCI scores can be published as part of a CI pipeline. Teams can set phase-specific carbon budgets — for instance, enforcing that the setup phase SCI never exceeds a threshold that would indicate a bloated initialisation routine — independently of the runtime budget.
Example Applications
We provide worked examples for a range of application types in our example applications repository:
- Static algorithms and AI/ML workloads — where per-phase SCI separates model loading from inference
- REST APIs — where SCI per request can be tracked independently across warmup and steady-state phases
- Idle scenarios — where the carbon cost of a running-but-idle service is made visible
Live measurement data for these examples is available at: Our GMT Dashboard
Relationship to the GSF SCI Specification
The GMT’s SCI implementation is aligned with the Green Software Foundation’s SCI specification. The per-phase extension does not alter the formula — SCI = (E * I + M) / R remains unchanged — but it applies the formula at a finer temporal granularity by scoping E and R to individual measurement phases rather than to the run as a whole. The embodied carbon term M is proportionally attributed to each phase based on its duration relative to the total run time.
This approach is consistent with the SCI specification’s intent that the metric should reflect the carbon cost of a specific functional unit of work, since different phases may represent qualitatively different units of work even within a single benchmarking scenario.
Getting Started
- Instrument your application to emit a unit-of-work counter to STDOUT in the format
<timestamp_ns> <metric_name>=<value>. - Declare the metric under
custom_metricsin yourusage_scenario.ymlwithsci: true. - Populate the
sciblock in yourconfig.ymlwith values appropriate to your hardware and grid location. Sources for embodied carbon are listed in our embodied carbon documentation and for grid intensity in our grid carbon intensity documentation. - Run your scenario and inspect the per-phase SCI values in the dashboard or export them via the Green Metrics API.
Full documentation for the feature is available at: https://docs.green-coding.io/docs/measuring/carbon/sci/
What Comes Next
Phase-level SCI is a foundation for more granular carbon accounting within the GMT. We are actively working on:
- CarbonDB integration for persisting per-phase SCI time series across benchmark runs, enabling longitudinal analysis of how each phase’s carbon profile evolves as a codebase changes
- Badge generation for individual phases, allowing teams to publish not just a single SCI badge but a phase-annotated carbon profile of their software
- Threshold-based alerting in the CI integration, so that a regression in a specific phase’s SCI triggers a pipeline failure independently of the aggregate score
The goal is to make carbon a first-class observable in software engineering — with the same phase-level resolution that developers already expect from CPU profilers and distributed tracing systems.
If you have questions or want to share your own per-phase SCI measurements, reach out via our GitHub repository or the Green Software Foundation community channels.