In an earlier version of the article the calculation statement contained a message about us being confused why the conversion factor is 277000000. Thanks to Silas Duddeck from the Goethe University in Frankfurt who pointed out that the factor should be 1J = 2,777778⋅10-7kWh = (1/3600000)kWh => 277777777
Trying out Firefox 104 energy measurements
- by Arne Tarara 
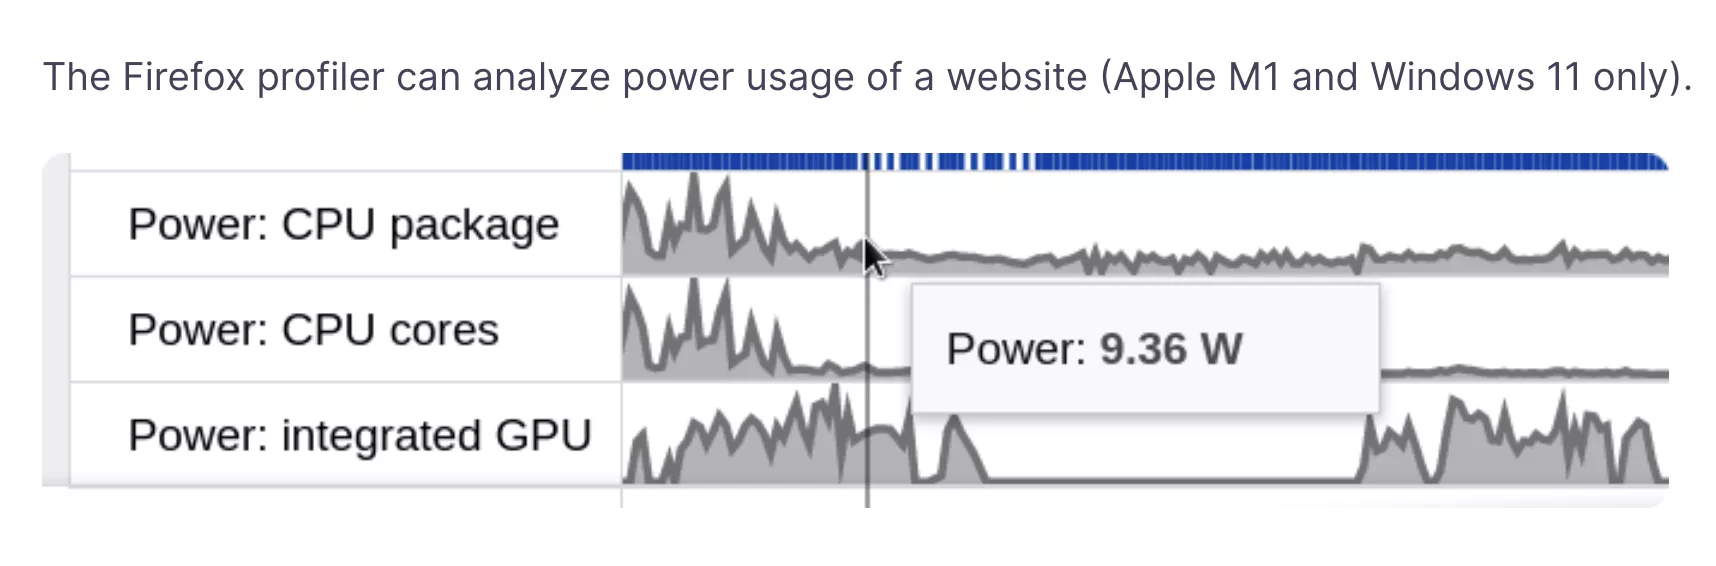
Mozilla released a new version 104 this week which sports a power measurement feature.
This immediately sparked our interest and we wanted to give it some test run against a containerized browser in our Green Metrics Tool.
According to the information from Mozilla this works only for M1 Macs or on Windows 11.
Since our Green Metrics Tool runs on Linux only we could not really make comparisons on one machine, but we could give it a first look none the less and look into some details where the values are coming from.
Research Questions
We wanted to answer the following questions:
- How much does a visit to a website, we choose the one of the Umweltbundesamt, consume in terms of energy?
- We are using an MacBook Pro (14-inch, 2021) with an M1 Pro and 32 GB of RAM. macOS 12.5.1
- How do these values compare to our test machine, an Intel i7 MacBook Pro running Ubuntu 22.04, that runs the Green Metrics Tool and reads from the RAPL interface?
- Where are the energy values coming from on macOS and on Windows 11?
- Why is Windows 10 not able to deliver these values?
First results on an M1 Mac
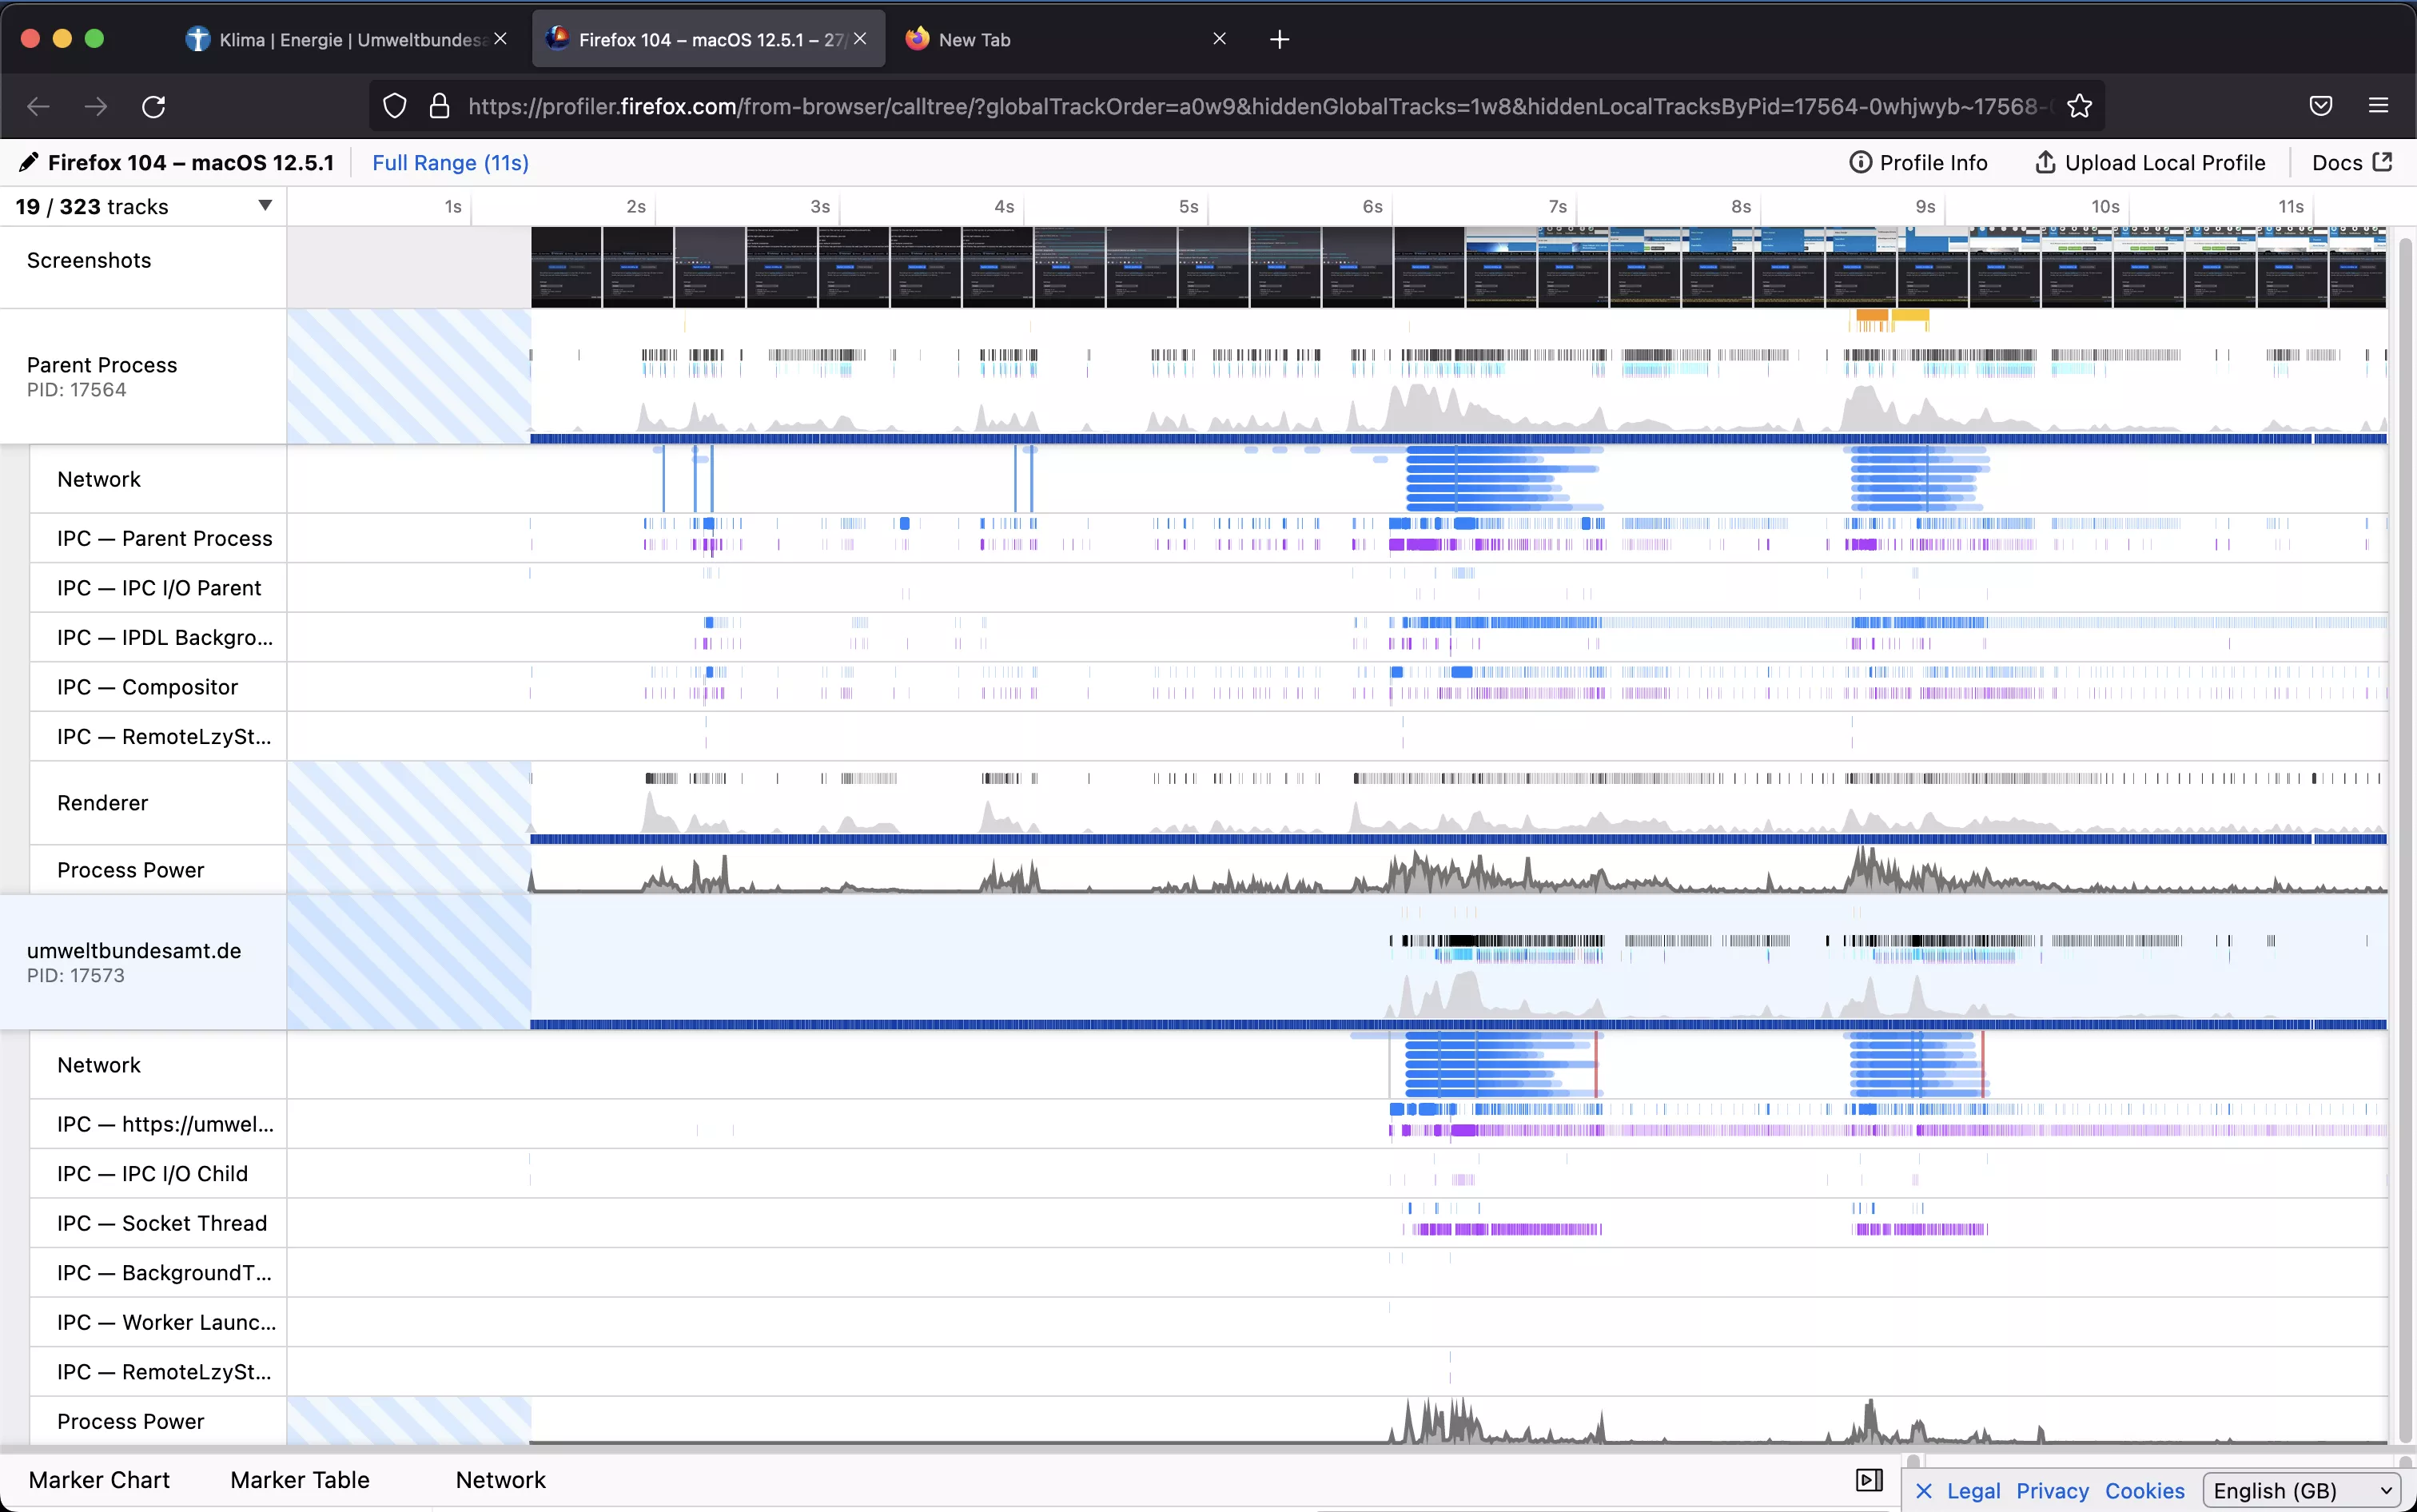
In order to create the power profile all you have to do is open the Developer Tools and (CMD + option + I) and then go to the Performance Tab (Laufzeitanalyse in German).
Clicking on Start recording and then clicking Capture recording will open up a new Tab where you can inspect the whole performance analysis.
Only the ones labeled Process Power are relevant for the Power output total.
Firefox actually splits the power per process, which is quite unusual for the RAPL readings we have come accross so far, but more on that later, when we look at the source code.
The spikes for visiting the Umweltbundesamt.de homepage where at the typical spots and did not exceed 4 W in our case.
In order to get an energy value we somehow have to sum up these values though with their respective time measurement interval. Sampling time we defined was 10 ms.
The profiler is able to export a JSON Dump if you click on Upload local profile in the top right corner and then Download it.
A script to convert this we have attached in our Github repository.
Apparently we had to convert all readings in the JSON by the weird value of 277000000 and
are unsure where this value is coming from …. but at least it makes the raw values from
the JSON to be identical with the values we see in the profiler UI.
The conversion to Joules is: 1J = 2,777778⋅10-7kWh = (1/3600000)kWh
Summary on the M1 Mac
The profiler is a very nice and easy tool to use in order to get the power readings.
Splitting it up by process is very convenient and allows for drilldown if the main process (UI) was consuming the load or the Javascript on the page or the rendering.
To our understanding the impact of the profiler itself is not visible and it is unclear if that is factored in into the Parent Process.
A visit to the Umweltbundesamt.de page by just opening the main page, letting the load finish and then waiting 2 seconds did incur an energy cost of around 2mWh.
Although we also had two very unusal measurements of ~40 mWh that we were not able to reproduce later the measurements seemed generally very stable.
We repeated 10 measurements in total. Since it was just a first look and measurements where started and stopped manually we opted for not reporting Std.Dev. etc, as the manual handling has probably more influence here anyway …
This is the code we used to sum up the power measurements:
 # wattage.py

 import json

# The entries in sampleGroups are distinct they have to be added up and
# are not a partial sum of each other.
# This can be falsified in the profiler with individual PIDs having greater
# wattage than the parent process

import argparse

parser = argparse.ArgumentParser()
parser.add_argument("filename", type=str, help="Please supply the filename that shall be parsed")

args = parser.parse_args()

with open(args.filename) as a:
    my_json = json.load(a)
    for node in my_json['counters']:
        if node['description'] == 'Power utilization':

            values = zip(node['sampleGroups'][0]['samples']['count'], node['sampleGroups'][0]['samples']['time'])
            joule_sum = 0
            prev = 0
            for key, value in values:
                joule = key / 277777777
                wattage = (joule / ((value - prev)/1000))
                #print(joule, wattage)
                joule_sum += joule
                prev = value
            print("Sum is", joule_sum, "for pid", node['pid'], " which is mWh:", joule_sum/3.6)
Comparison on MacBook Pro 2015
On our MacBook Pro Mid-2015 with an Intel Core i7-5557U @ 3.1 GHz running Ubuntu 22.04 we executed a measurement with our container based setup with the Green Metrics Tool.
You can find one sample measurement here
The component energy of CPU and DRAM, which is probably the most comparable, here is at 36.9 mWh
It is important to note that this is not the energy per process, but the energy for the whole system.
Measurements between machines are anyway not comparable that easily, as they will have non linear load curves that you would have to account for.
Takeaway
So the takeaway and also what we wanted to find out as a research question from the start is that the M1 power measurements in Firefox seem to produce a value that looks very interesting and deserves further inspection.
- It seems to give very similar values between repeated measurements
- It seems to be already split by task and not only report the total machine power
- It is VERY easy to use if you have used the developer tools before. It is really just two clicks
- It however is unclear to us if we can trigger the profiling programmatically and not manually, which would increase the reproducability greatly
Further plans
We were very suprised that the XNU kernel in macOS supplies a feature that can really deliver the energy per task.
This is what was the most interesting for us.
If you look into the current source tree of Firefox stable it is visiibe that the code to instrument the measurement on macOS is not too complex.
However finding relevant documentation posed a problem at the time of writing this article.
We will definitely have a further look into this, but if anyone has experience with that interface on macOS or can give us a head start where to find the relevant documentation for it, please reach out!
Also for the Windows folks: Firefox 104 queries the EMI API from Windows. This one seems to also have functionality on Windows 10 if you have a power meter chip installed … WOW!
We have never heard of that so far! But apparently the Surface Book 1 has it (Source discussion).
If you have more info on this, please let us know!