
Something we often encounter when talking to clients is that they often have no idea of how much energy the various components in their pipeline use. We have developed multiple projects like Eco-CI that measures the energy usage of CI/CD pipelines or Power Hog which logs energy consumption on desktops. But to date is was not possible to see how much your servers use.
In our effort to open source most of our developments we are happy to announce the public release of the Eco-Server project and the release of the CarbonDB backend in the Green Metrics Tool. This is a big step for us a company as it enables us to monitor even more resources in the Software Life Cycle. To read more about Software Life Cycle Assessment please check out our articles SLCA PART 1 and SLCA PART 2.
Eco-Server
The Eco-Server project aims to be a simple drop in solution to give you energy consumption of your servers. You can find all the details on our eco-server GitHub page
While developing the Eco-CI project we noticed that is is quite hard to get the actual energy usage of most servers that are used today. This has a multitude of reasons. One being that cloud providers don’t normally give you access to IPMI or RAPL that would would enable you to get some estimation. Another one is that most machines are shared and that even if you would have these values it would be close to impossible to split these out of a VM. Because of this we developed a machine learning model based of the spec power database that takes cpu utilization, vhost number and then gives you an energy estimate. You can find all the details under the Cloud Energy ML model Github page .We can now use this to also get the values for our servers. An easy to install solution can be found in the xgb folder in the eco-server-energy-estimation GitHub repo.
This starts a service on your server that periodically logs the energy consumed to the systemd journal. You can configure the interval and fine tune the parameters for a more accurate reading. While the tool works really well with the CarbonDB you can also use it with your existing monitoring solution. That is why we have included the get_values.py script that gives you the available energy readings. You can then use this to feed this data into logstash or something similar. Here is an example server that I have visualized with Grafana:
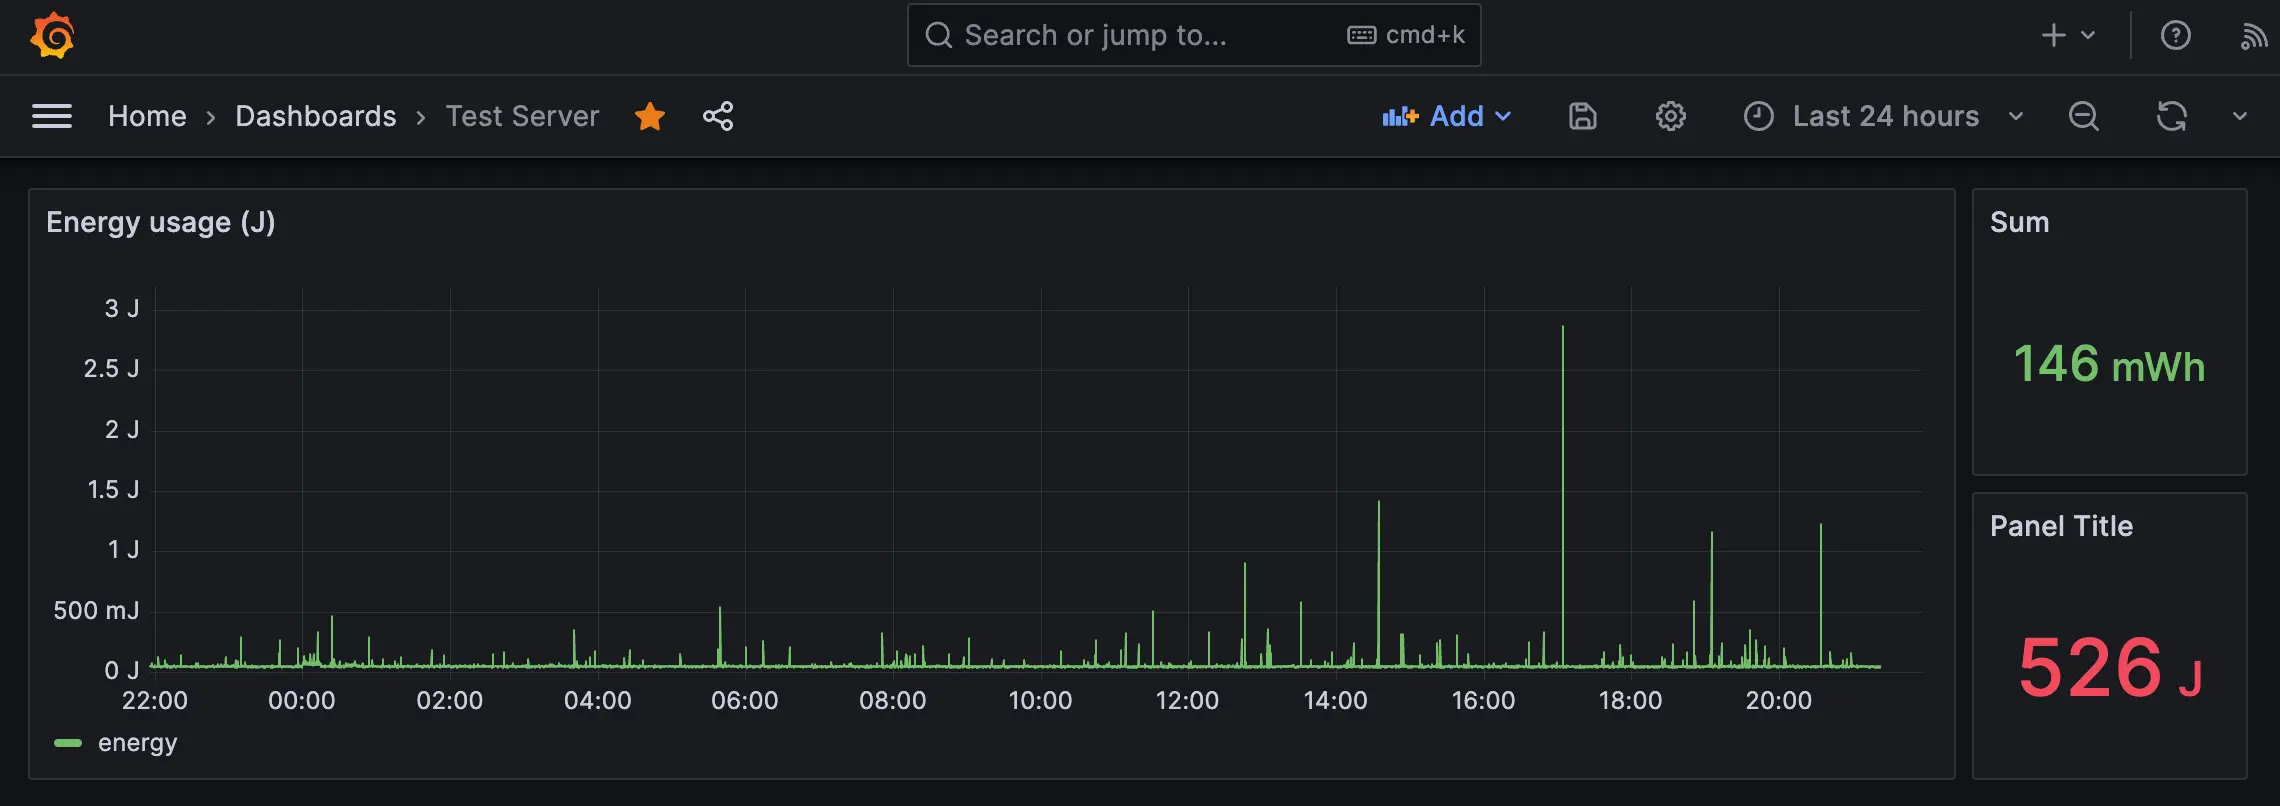
You can see that most of the time this server goes into a sleep state and does not use a lot of energy at all. This is down to the machine being a VM and the host system actually suspending the machine.
This is a really nice as it can give you energy usage without a lot of overhead and you can easily integrate it into your already existing monitoring solutions. You can now report how much energy all your servers have used and see which servers are idling and using up a lot of energy. Something we quite often see in cloud machines. We are constantly working on this and will continue to publish our work as open source. Soon you can expect packages and Terraform file. Please let us know what would help you to deploy this in your setup.
CarbonDB
While knowing your energy usage is already a really nice thing to have we wanted to make it as easy as possible to gather the data. One thing I am always really interested in is the amount of CO2 that was produced in running my service. So we extended the Green Metrics Tool to include a carbon database which receives the energy values from your servers, finds out where they are located and then looks at the grid carbon intensity. This gives you a really good understanding of how “dirty” your workload is. We have implemented it so that you don’t need a login and you can group your servers by project, company and give machines tags. This should enable you to give a detailed reporting. Currently we don’t offer detailed analytics in the free plan as the amount of data we need to save is quite large.
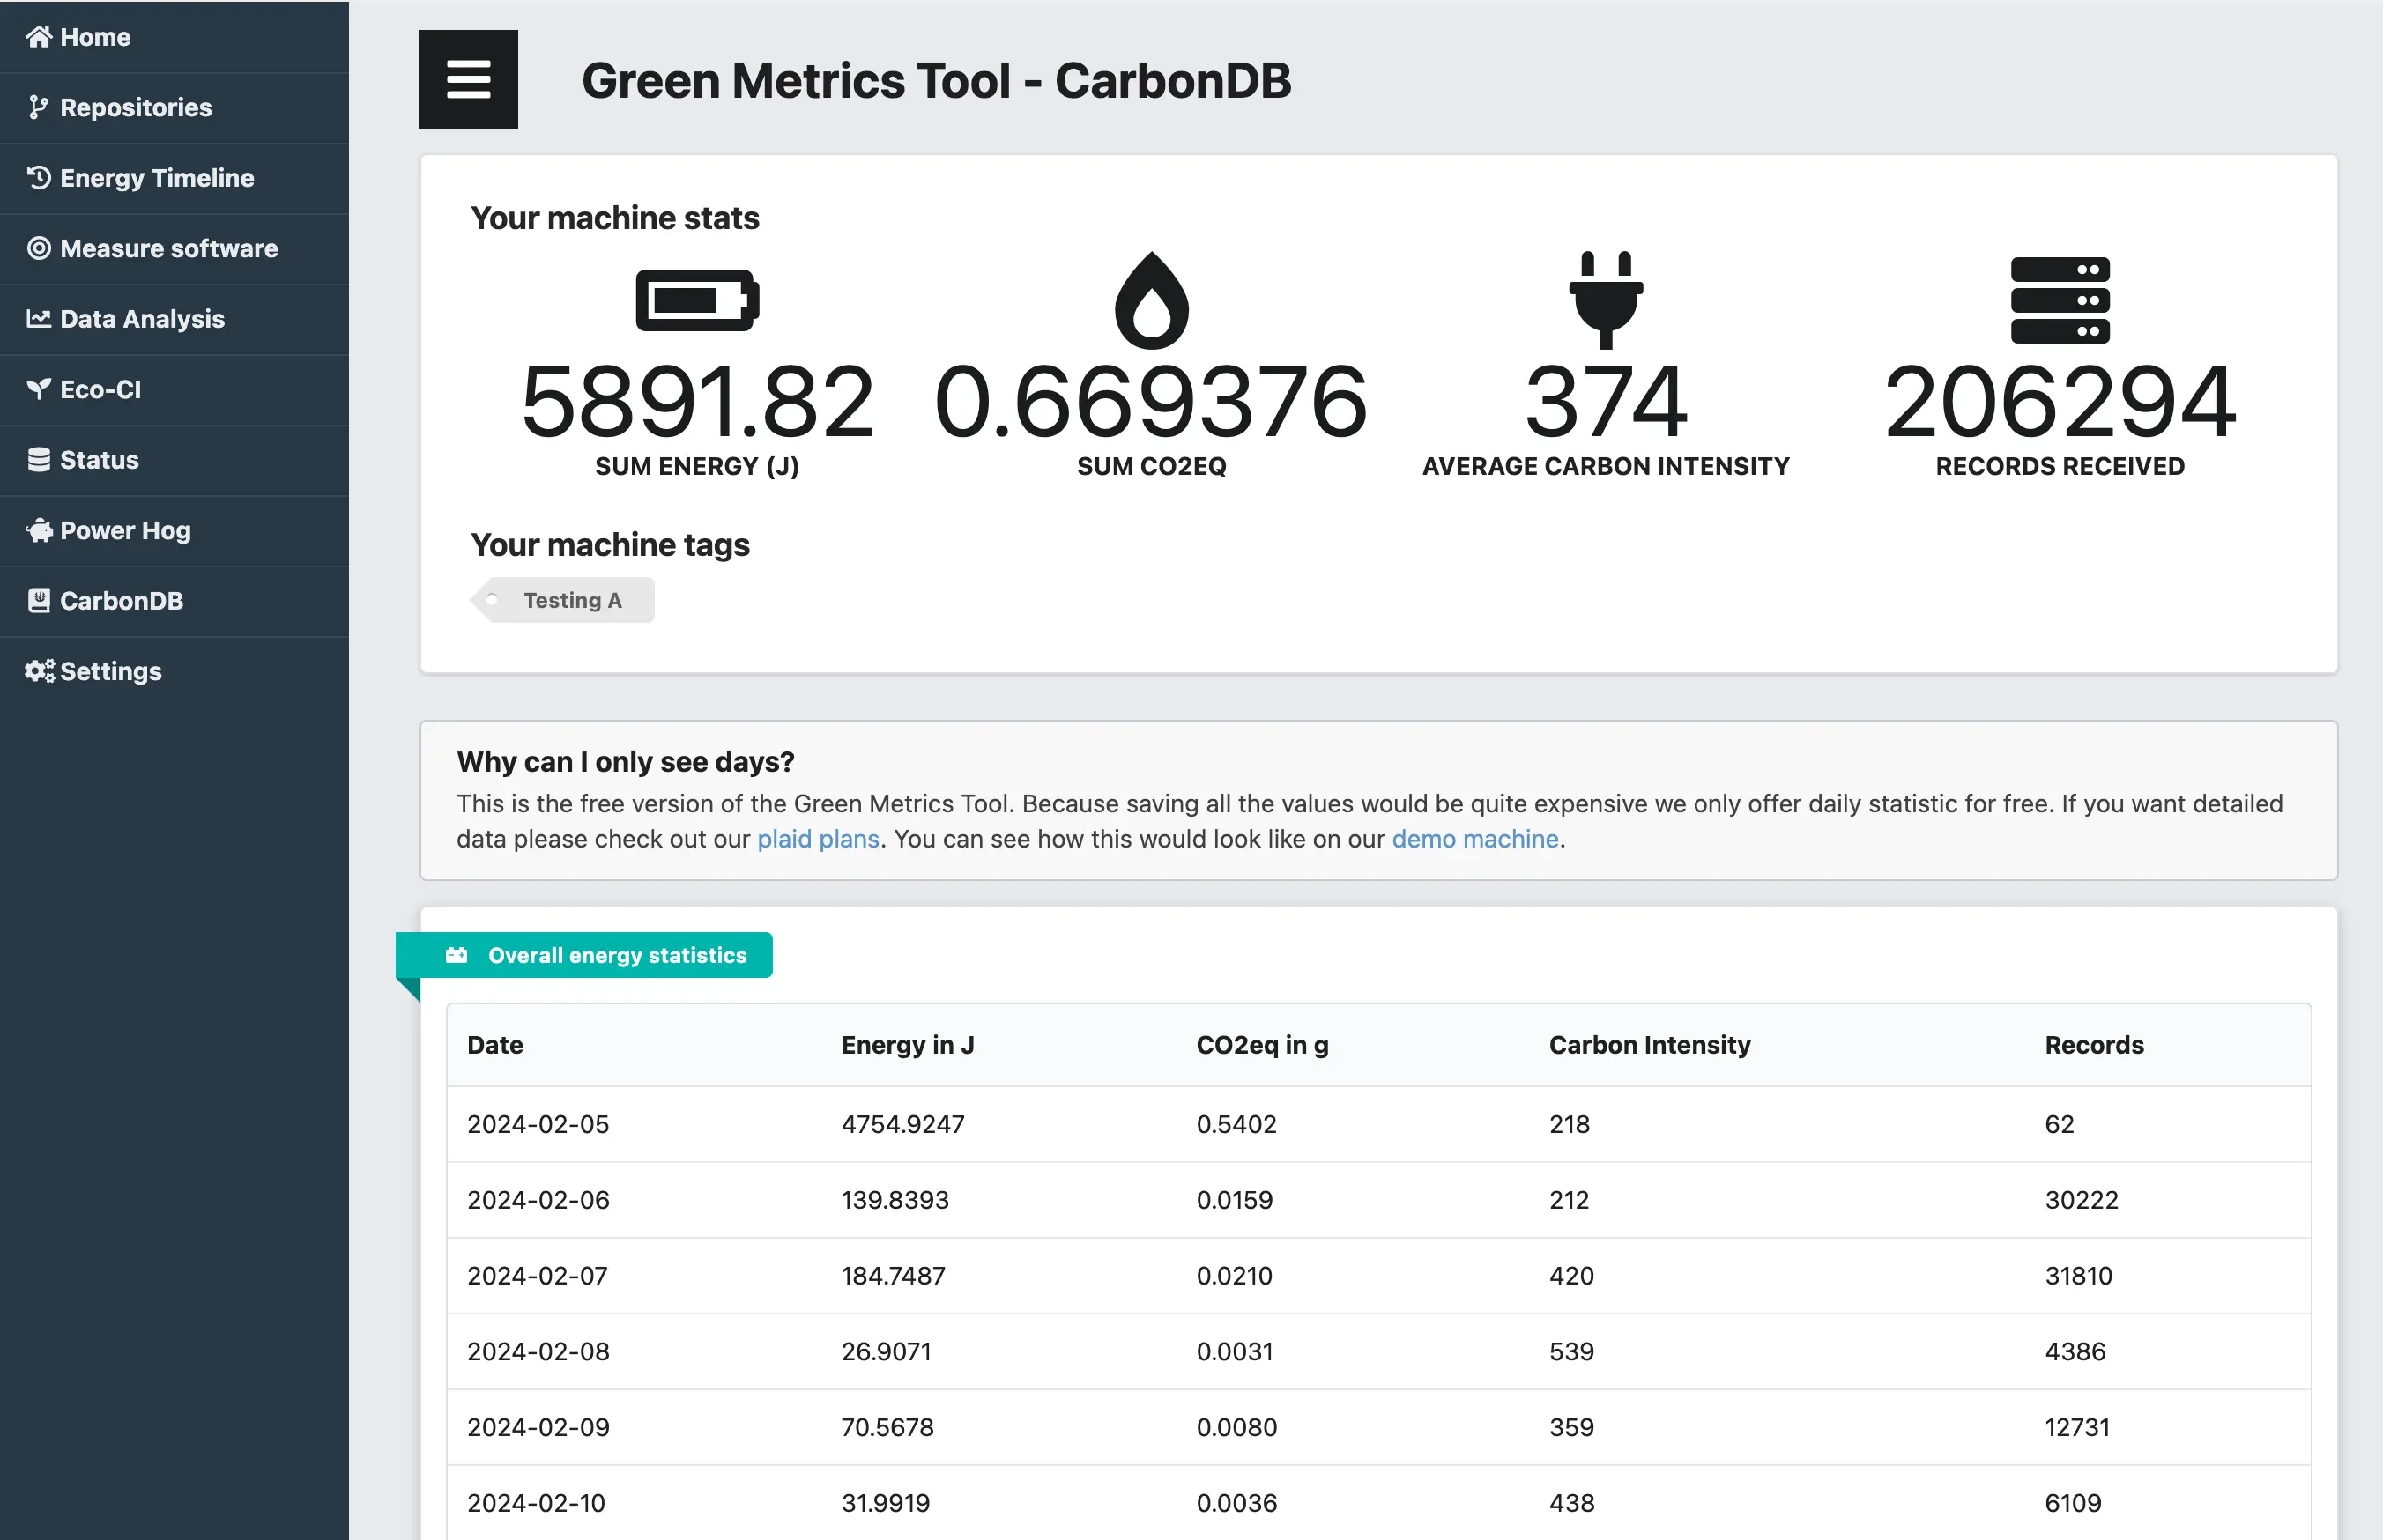
This shows the view you will get for a machine. It shows you the sum of of all the energy the machine has used, the CO2eq, the average Carbon Intensity and how many records we have used to generate these values. You can also see a list aggregated by day. We are planning on giving you detailed analytics as we already do for the Power Hog or Eco-CI. This is a really useful tool for any company that wants to record their impact.
See an example whow the data looks on our Green Metrics Tool Dashboard Machine, which is also included in Carbon DB.
You can find the CarbonDB uploader on our Github repo
It comes with an easy install.sh script that installs a timer that runs every 10 minutes and uploads all the values to a Green Metrics backend. You can use our hosted solution or host it yourself.
We are aware that this currently only works on machines on which you can install programs and will not work for lambda functions or SaaS solutions. But it is a further step towards gaining insights and another piece of the puzzle to get a complete view of your impact.