
CPU utilization is an interesting value to use if you ware interested in either energy usage or optimizing your code.
We have written a long case study on if it is useful in the first place. Long story short: not really. It used to be a good metrics before cpus would scale dynamically, you had on type of cpu and not multiple performance/ energy cores that each do their own thing and things were a lot simpler. But in modern computers the utilization is somehow interesting but not really much worth in terms of an exact metric.
It seems to be though the thing a lot of people have agreed on that is safe sharing especially in shared cloud environments. So we developed an XGBoost model named Cloud Energy to estimate the energy impact certain code has depending on the cpu utilization.
Now we also want to support macOS and so to run the models in the Green Metrics Tool we also needed a way to access the cpu utilization under Mac. This seems quite straight forward if you search the internet for a little while. You can use the host_statistics [0] call which will populate a struct host_cpu_load_info_data_t which will return the values for CPU_STATE_USER, CPU_STATE_SYSTEM, CPU_STATE_IDLE and CPU_STATE_NICE which you can then use to calculate the current cpu load. A short code example can look as such:
unsigned int msleep_time = 1000
host_cpu_load_info_data_t prevCpuLoad;
host_cpu_load_info_data_t currCpuLoad;
mach_msg_type_number_t count = HOST_CPU_LOAD_INFO_COUNT;
kern_return_t status;

memset(&prevCpuLoad, 0, sizeof(prevCpuLoad));

while (1) {
    status = host_statistics(mach_host_self(), HOST_CPU_LOAD_INFO, (host_info_t)&currCpuLoad, &count);
    if (status != KERN_SUCCESS) {
        printf("Failed to retrieve CPU load information\n");
        return 1;
    }

    natural_t userDiff = currCpuLoad.cpu_ticks[CPU_STATE_USER] - prevCpuLoad.cpu_ticks[CPU_STATE_USER];
    natural_t systemDiff = currCpuLoad.cpu_ticks[CPU_STATE_SYSTEM] - prevCpuLoad.cpu_ticks[CPU_STATE_SYSTEM];
    natural_t idleDiff = currCpuLoad.cpu_ticks[CPU_STATE_IDLE] - prevCpuLoad.cpu_ticks[CPU_STATE_IDLE];
    natural_t niceDiff = currCpuLoad.cpu_ticks[CPU_STATE_NICE] - prevCpuLoad.cpu_ticks[CPU_STATE_NICE];
    unsigned long long computeDiff = userDiff + systemDiff + niceDiff;
    unsigned long long totalDiff = userDiff + systemDiff + idleDiff + niceDiff;

    if (totalDiff > 0) {
        float userPercent = (userDiff / totalDiff) * 100.0;
        float systemPercent = (systemDiff / totalDiff) * 100.0;
        float nicePercent = (niceDiff / totalDiff) * 100.0;

        printf("User CPU utilization: %.2f%%\n", userPercent);
        printf("System CPU utilization: %.2f%%\n", systemPercent);
        printf("Nice CPU utilization: %.2f%%\n", nicePercent);
    }

    prevCpuLoad = currCpuLoad;

    usleep(msleep_time*1000);
}
If you know C this looks quite simple. The code will loop indefinitely and loads the data through the host_statistics call and then subtracts the values from the previous run. It then waits for a certain time msleep_time before re-running.
This works and gives you realistic values. You can check this quite quickly with stress-ng.
But like always there is a problem!
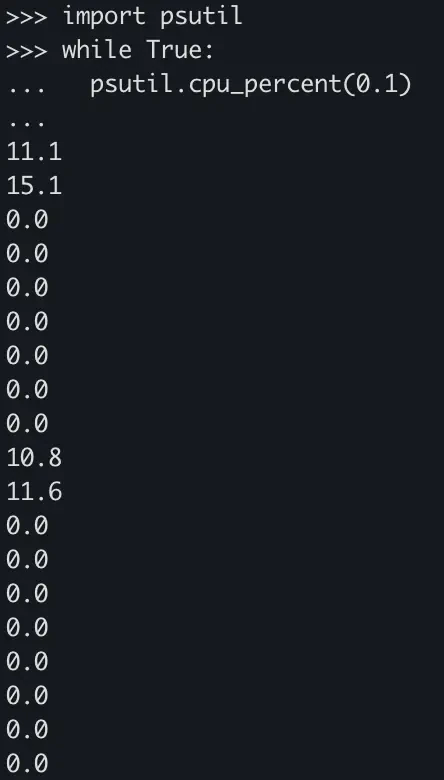
If you reduce the time to under 500 ms, that the script should wait till it loops, you start getting 0 values as host_statistics returns the same data. It is not exactly 500 ms and it varies on machines but around that time it starts returning the same values.
Apple is notoriously bad at documenting their software but it looks like the kernel just updates the data every n ticks. Which makes sense from a performance perspective. Normally you wouldn’t need a higher resolution. We looked how other tools implement getting cpu data and even psutil [1] has the same problem. You can see the details in the
bug report that we filed.
Doing more research there is actually some caching int the host.c file that caches the results but I didn’t do a deep dive why the statistics are not updated.
While the implications are minor we didn’t want to ship code that would not perform with a high resolution on MacOS. After some searching around we found that htop uses the host_processor_info[2] kernel call which internally uses the processor_info[3] call which also gives you the cpu load statistics on a per processor basis. And this gives a far higher resolution. So we can rewrite the code to look like:
void loop_utilization(unsigned int msleep_time) {
    processor_info_array_t cpuInfo = NULL, prevCpuInfo = NULL;
    mach_msg_type_number_t numCpuInfo, numPrevCpuInfo;

    while(1){
        natural_t numCPUsU = 0U;
        kern_return_t err = host_processor_info(mach_host_self(), PROCESSOR_CPU_LOAD_INFO, &numCPUsU, &cpuInfo, &numCpuInfo);

        if (err == KERN_SUCCESS) {

            float ut_total = 0U;
            struct timeval now;

            for (unsigned i = 0; i < numCPUsU; ++i) {
                float inUse, total;
                if (prevCpuInfo) {
                    inUse = ((cpuInfo[(CPU_STATE_MAX * i) + CPU_STATE_USER] - prevCpuInfo[(CPU_STATE_MAX * i) + CPU_STATE_USER]) +
                            (cpuInfo[(CPU_STATE_MAX * i) + CPU_STATE_SYSTEM] - prevCpuInfo[(CPU_STATE_MAX * i) + CPU_STATE_SYSTEM]) +
                            (cpuInfo[(CPU_STATE_MAX * i) + CPU_STATE_NICE] - prevCpuInfo[(CPU_STATE_MAX * i) + CPU_STATE_NICE]));
                    total = inUse + (cpuInfo[(CPU_STATE_MAX * i) + CPU_STATE_IDLE] - prevCpuInfo[(CPU_STATE_MAX * i) + CPU_STATE_IDLE]);
                } else {
                    inUse = cpuInfo[(CPU_STATE_MAX * i) + CPU_STATE_USER] + cpuInfo[(CPU_STATE_MAX * i) + CPU_STATE_SYSTEM] + cpuInfo[(CPU_STATE_MAX * i) + CPU_STATE_NICE];
                    total = inUse + cpuInfo[(CPU_STATE_MAX * i) + CPU_STATE_IDLE];
                }
                ut_total = ut_total + (inUse / total);
            }

            gettimeofday(&now, NULL);
            printf("%ld%06i %i\n", now.tv_sec, now.tv_usec, (int)(ut_total * 100 / numCPUsU));

            if (prevCpuInfo) {
                size_t prevCpuInfoSize = sizeof(integer_t) * numPrevCpuInfo;
                vm_deallocate(mach_task_self(), (vm_address_t)prevCpuInfo, prevCpuInfoSize);
            }

            prevCpuInfo = cpuInfo;
            numPrevCpuInfo = numCpuInfo;

            cpuInfo = NULL;
            numCpuInfo = 0U;
        } else {
            fprintf(stderr, "Error: %s\n", mach_error_string(err));
        }

    usleep(msleep_time*1000);
    }
}
which now gives you a far higher resolution. You can find the whole program in the Green Metrics Tool metrics reporter